
Abstract
The alignment of chromophores plays a crucial role in determining the optoelectronic properties of materials. Such alignment can make interpretation of fluorescence anisotropy microscopy (FAM) images somewhat ambiguous. The time-resolved emission behaviour can also influence the fluorescence anisotropy. This is particularly the case when probing excitation energy migration between chromophores in a condensed phase. Ideally information concerning the chromophoric alignment, emission decay kinetics and fluorescence anisotropy can be recorded and correlated. We report on the use of polarised transmission imaging (PTI) coupled with both steady-state and time-resolved FAM to enable accurate identification of chromophoric alignment and morphology in thin films of a conjugated polydiarylfluorene. We show that the combination of these three imaging modes presents a comprehensive methodology for investigating the alignment and morphology of chromophores in thin films, particularly for accurately mapping the distribution of amorphous and crystalline phases within the thin films, offering valuable insights for the design and optimization of materials with enhanced optoelectronic performance.
Export citation and abstract BibTeX RIS

Original content from this work may be used under the terms of the Creative Commons Attribution 4.0 licence. Any further distribution of this work must maintain attribution to the author(s) and the title of the work, journal citation and DOI.
Introduction
Understanding the morphology of thin-film semiconducting materials is essential for optimizing their electronic and optical properties. A crucial factor influencing film morphology is the alignment of chromophores within polymer films, as it significantly impacts charge transport and light-emitting properties [1–3]. For example, in organic photovoltaics, the alignment of polymer chains gives rise to well-organised domains that facilitate efficient charge separation and excitation energy transport, thereby influencing device performance [4, 5]. Likewise, in organic light-emitting diodes (OLEDs), the alignment of chromophores governs not only the efficiency of light emission but also the colour of the emitted light [6, 7]. Hence, the accurate characterisation of chromophore alignment assumes great significance in these applications, however, achieving precise and comprehensive characterisation of chromophore alignment poses challenges.
Polarised fluorescence (anisotropy) measurements are widely used to probe phenomena that lead to the depolarisation of emission, and these measurements can be performed in either steady-state or time-resolved modalities. Molecular rotation is the most commonly explored process using this approach, when the timescale of molecular rotation is approximately the same as the excited-state lifetime of the fluorescent probe. However, other phenomena can lead to the depolarisation of emission [8] including excited-state photophysics [9] and excitation energy transfer and migration (figure 1). It is the latter that we investigate here.

Figure 1. A schematic diagram of photo-selection and emission depolarisation. After a group of randomly aligned molecules are irradiated by polarised light, only those molecules with their absorption transition dipoles predominantly aligned with the excitation polarisation can be excited. However, the orientation of the emission transition dipoles can be different to the absorption dipole direction, leading to depolarisation of emission.
Download figure:
Standard image High-resolution imagePolarised incident light can photoselectively excite molecules that have components of their absorption transition dipole moment vectors oriented parallel to the plane of the excitation polarisation. If the initially excited chromophore emits, the polarisation of the emission will be preferentially biased towards the direction of the fluorophores' emission transition dipole moments, and additionally randomised due to any molecular motion that occurs within the lifetime of the excited state (figure 1). This rotational motion is modelled by the Perrin equation which relates emission depolarisation (in terms of fluorescence anisotropy, r, equation (1)) with chromophoric rotation and the intrinsic anisotropy property of the fluorophore, r0 , that accounts for the angle between the fluorophore's absorption and emission transition dipole moments.

where  and
and  are fluorescence intensities polarised parallel and perpendicular to the excitation polarisation. Low anisotropy values represent the existence of efficient depolarisation processes, while high anisotropy values account for an emission bias and polarisation retention. Fluorescence anisotropy is therefore often used as a method with which to measure the degree of depolarisation of emission following preferentially polarised excitation of fluorophores [8, 10–12]. Fluorescence anisotropy microscopy (FAM) is widely used in probing rotational motion in biological systems [13–15].
In a sufficiently concentrated molecular ensemble, excitation energy of a given photoexcited chromophore can be passed on to another chromophore prior to the emission of light, often via a dipole–dipole resonance energy transfer mechanism, widely interpreted through Förster's modelling, so commonly referred to as Förster resonance energy transfer (FRET). The energy acceptor can be of the same molecular species (given sufficient spectral overlap of the chromophore's emission and absorption spectra)—often referred to as 'homo-FRET', [16] or another (acceptor, A) species with absorption energy equal to or lower than the original (donor, D) molecule. The efficiency of energy transfer depends on the overlap of the emission and absorption spectra involved, and the relative orientations of the donor emission and acceptor absorption transition dipole moments, given by the term  where θT
is the angle between the unit vectors
where θT
is the angle between the unit vectors  and
and  θD
is that between
θD
is that between  and
and  and θA
is that between
and θA
is that between  and
and  where
where  is along the emission transition moment of the donor,
  along the absorption transition moment of the acceptor, and
  points from the centre of the donor to the centre of the acceptor [17]. This angular dependence of the interacting transition moments results in a level of depolarisation of the emission (from the acceptor following absorption by the donor). If the D and A are free to independently sample all possible orientations, the average value of
  is often assumed (rightly or wrongly) to be 2/3 [18].
Efficient fluorescence depolarisation can still occur in solid-state samples despite molecular motion, that is prevalent/dominates in solutions, being absent or severely inhibited [19, 20]. This emission depolarisation is often associated with energy transfer processes discussed above. Due to the high local concentration of chromo/fluorophores in some solid samples, excitation energy can be relocated some distance from its original point of absorption, through the process of excitation energy migration (EEM). EEM can occur either coherently in strongly coupled systems, or via a hopping mechanism between more weakly coupled chromophores, often assumed to be a series of FRET steps. In the latter case, excitation energy absorbed by a given chromophore is passed on to nearby chromophores, and can be subsequently emitted from any chromophore in the energy transfer sequence. Since a number of energy transfer steps can occur, and each will involve some decrease in the polarisation of the emission, the degree of depolarisation will be related to the number of energy transfer hops prior to emission. This has been described by Weber [21] and in later work it was reported that the fluorescence emission is usually completely depolarised (i.e. r = 0) after five to ten energy transfer steps [22]. The level of fluorescence polarisation can then be mapped across the solid sample using FAM to monitor the regions of more or less efficient energy transfer. Low emission anisotropy values are often interpreted as corresponding to regions exclusively exhibiting efficient energy transfer, and high anisotropy values with areas that are not undergoing efficient EEM, but this can be a misinterpretation.
As discussed above, the efficiency of EEM between weakly coupled chromophores, and thereby the depolarisation of the film's emission, will be strongly dependent on the orientation between the various interacting donor and acceptor chromophores. Both EEM and depolarisation will also be dependent on the degree of alignment adopted by the original light absorbing chromophores within the film during the film formation process—this is not something that needs to be considered in FAM applications of samples undergoing molecular motion. This is demonstrated in figure 2. In a highly aligned molecular system (figure 2(a)), regardless of whether or not energy transfer/migration occurs, the observed emission anisotropy will be consistently high; the value of r can approach unity in a well aligned system. Such a situation is unlikely to be observed on the spatial scales recorded in the current work. Conversely, in a poorly (randomly) aligned system (figure 2(c)i), where EEM might be expected to be reasonably inefficient, the detected anisotropy will be lower than unity, but still approaching 0.4, as would be observed for photoselection of fluorophores with parallel absorption and emission transition moments in an isotropic, frozen solution or rigid matrix, due to the cos2
 dependence (where
  is the average angle of the emission transition dipoles relative to the z-axis) [10]. Energy transfer in this system would lead to depolarisation of the emission (r ≈ 0, figure 2(c)(ii). However, the situation becomes more complex in a system with reasonably good molecular alignment (figure 2(b)). In such cases, the absence of energy transfer (2(b)(i) results in a reasonably high emission anisotropy value (r < 1), while the presence of efficient energy transfer (2(b)(ii) leads to some level of depolarisation of the emission signal, resulting in a lower anisotropy value (0 < r ≪ 1). Consequently, assessing the alignment of chromophores and the existence of depolarisation processes solely based on fluorescence anisotropy measurements is challenging, but such information is important for correct interpretation of emission anisotropy particularly in relation to EEM.

Figure 2. An illustration of the relationship between anisotropy and molecular alignment with the influence of energy transfer.
Download figure:
Standard image High-resolution imageIn addition, the fluorescence decay time can influence the value of r recorded from a sample. This is borne out in the Perrin equation; a short fluorescence decay time means that the sample spends little time in the excited state, and for a given rotational correlation time, τc
, the emission will not have sufficient time to become as depolarised through rotational motion as it would for a system with a longer excited-state lifetime. It is also reflected in the definition of r (equation (1)); the denominator ( + 2
+ 2  ) corresponds to the total fluorescence from the sample (or the fluorescence decay time, τf
, in the absence of depolarising processes in time-resolved measurements), so a large value of τf
will lead to a small value of r as there is more time for the emission depolarising (
) corresponds to the total fluorescence from the sample (or the fluorescence decay time, τf
, in the absence of depolarising processes in time-resolved measurements), so a large value of τf
will lead to a small value of r as there is more time for the emission depolarising ( −
−  ) process (e.g. chromophoric rotation or energy transfer) to occur.
The complexity of fluorescence decay time, molecular alignment, and fluorescence anisotropy has been addressed by other researchers. Polarised steady-state and time-resolved studies have been performed on thin films of a conjugated polymer whose chains had been aligned through a nanoimprinting technique [23]. By recording time-resolved photoluminescence anisotropy measurements, the degree of alignment and the preferential orientation of exciton migration processes in F8BT were elucidated. However, in that work, only spectroscopic studies of bulk samples were performed, potentially overlooking any morphological inhomogeneities within the films that microspectroscopic analysis could reveal.
In this work we discuss the implications of molecular alignment and fluorescence decay times on FAM specifically in the context of studying films of conjugated light emitting polydiarylfluorene derivatives, of interest particularly for light emitting diode applications [24]. In the case of conjugated polymers, the chromophores are the segments of the polymer chain corresponding to various conjugation (or persistence) lengths. Energy can be transferred energetically downhill from the initially absorbing chromophore to lower energy (longer) conjugation length segments of the polymer chain, either intra- or inter-molecularly [25]. To overcome the factors that influence the recorded value of fluorescence anisotropy and gain a more comprehensive understanding of chromophore alignment in films of such materials, we propose a multimodal approach for FAM. We address the importance of recording polarised transmission ratio images (PTI) to assess the level of alignment in regions of the film, and simultaneously recording time-resolved emission microscopy (TREM) to interpret values of r relative to the regions' fluorescence decay time behaviour [26, 27]. The PTI and TREM maps can then be correlated to the fluorescence anisotropy images. The combination of PTI, TREM, and FAM and potentially emission spectral information measurement, offers a powerful and practical approach for comprehensively exploring the morphology and photophysics of thin films of conjugated polymers and other semiconductor materials.
As an exemplar application of our approach, we studied the conformation of a specific type of conjugated polydiarylfluorene, poly[4-(octyloxy)-9,9-diphenylfluoren-2,7-diyl]-co-[5-(octyloxy)-9,9-diphenylfluoren-2,7-diyl] (PODPF, figure 3).

Figure 3. Chemical structure of poly[4-(octyloxy)-9,9-diphenylfluoren-2,7-diyl]-co-[5-(octyloxy)-9,9-diphenylfluoren-2,7-diyl] (PODPF).
Download figure:
Standard image High-resolution imageExperimental approach
The concept of 'photo-selectivity' [10] is based on the fact that polarised light will be absorbed preferentially by those chromophores with an absorption transition dipole moment aligned predominantly with the direction of the excitation electric field polarisation. Based on this principle, polarised optical microscopy (POM) is widely used to help identify domains of different morphology (e.g. molecular alignment or liquid crystallinity) in thin films [28]. Polarised transmission imaging (PTI) enables direct visualisation and resolution of the orientations of absorption transition dipoles within thin films by comparing transmission images acquired under differently polarised incident light illumination. The principle of the polarised transmission image is shown in figure 4. In our implementation of PTI, the only polarisation optical element used is the polariser on the incident light source, unlike in many implementations of POM which have an additional polarisation analyser in front of the detector. When the absorption transition dipoles of chromophores inside the sample lie parallel to the incident electric field, the beam can be absorbed, resulting in dark areas in the transmission image. Conversely, if the dipoles are aligned with their absorption transition moments perpendicular to the incident beam polarisation, the incoming light will be transmitted, creating a brighter area in the transmission image. Therefore, regions of contrast in the polarised transmission image can be attributed to regions within the samples where molecules are preferentially aligned in different orientations. For amorphous samples with no preferred alignment, corresponding transmission images obtained under orthogonally polarised irradiation conditions should show no observable contrast. By comparing transmission images taken under illumination by orthogonally polarised light (figure 4, PTIx and PTIy), orientations of absorption transition dipoles inside samples can be resolved, which helps to further confirm the alignment of chromophores.
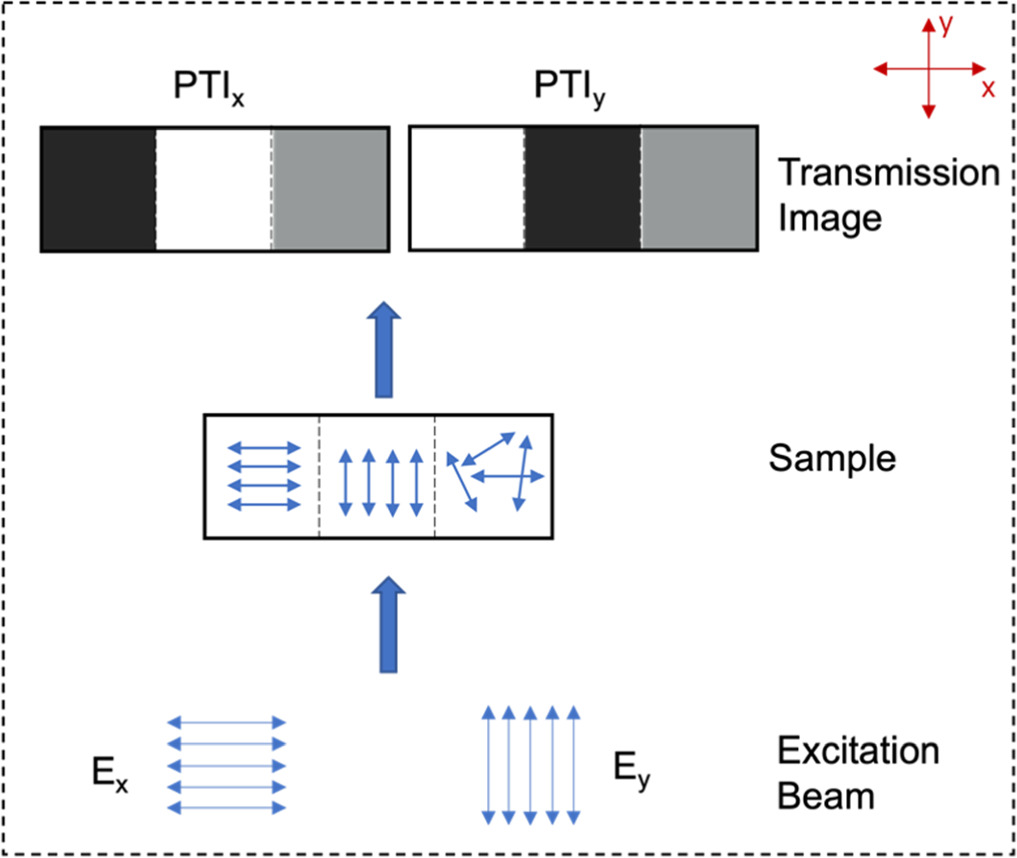
Figure 4. Working principle of polarised transmission imaging (PTI). PTI images of a sample with distinct morphological regions are compared under x- and y-polarised illumination (Ex and Ey). x- and y- axes are defined relative to the plane of microscope sample stage.
Download figure:
Standard image High-resolution imagePTI, time-resolved fluorescence and fluorescence anisotropy microscopy can be implemented in either widefield (e.g., using an intensified CCD or frequency domain camera) or point scanning modes. In this study, this combination of imaging modes has been executed on a time-resolved fluorescence anisotropy imaging (TR-FAM) system based on a galvanometer scanning confocal fluorescence inverted microscope. The TR-FAM/PTI apparatus developed in-house (figure 5) comprises a mode-locked laser as the excitation source (frequency doubled Ti:Sapphire or supercontinuum laser) coupled with time-correlated single photon counting detection. The excitation source used in this work is the 380 nm frequency-doubled output from a cavity dumped mode-locked Ti:Sapphire laser (Mira 900 f, Coherent; APE, PulseSwitch). Light from the laser was directed into the scan box (Fluoview FV300, Olympus), steered through a dual-axis fast scanning galvo mirror system, and into an inverted microscope (IX-71, Olympus) then focused onto the sample through a high NA objective (UplanApo 100X, NA = 1.4, Olympus). The fluorescence signal collected by the objective is separated from the excitation by a dichroic beamsplitter and into two polarisation components by a polarisation beamsplitter (CCM1-PBS251, Thorlabs) placed after the confocal aperture, then the two polarisation components are detected simultaneously by two TCSPC photomultipliers (SPC-150, Becker & Hickl). The detectors are connected to the B&H SPC system, allowing time- and polarisation dependent scanned confocal fluorescence images to be recorded simultaneously. PTI is performed using the conventional transmission detector positioned at the top of the microscope without any additional polarisation optics, mapping the transmitted polarised laser intensity as the sample area of interest is scanned by the galvanometer mirrors. The polarisation of the incident light was switched between 0 and 90° using a broadband halfwave plate (AQWP10M-580, Thorlabs) placed inside the scanner unit prior to the dichroic beamsplitter separating the excitation from emission.

Figure 5. A schematic diagram of the time-resolved fluorescence anisotropy imaging (TR-FAM) apparatus. RC: reflective collimator; P: polariser; DM: dichroic mirror; λ/2: half-waveplate; PBS: polarised beam-splitter; PMT: photomultiplier tube. FAM and TREM images are collected using PMTs 1 and 2 with the SPC-150 card and polarised transmission images are acquired simultaneously using the standard transmission PMT of the microscope frame and Olympus FluoViewTM software.
Download figure:
Standard image High-resolution imageFilms of poly[4-(octyloxy)-9,9-diphenylfluoren-2,7-diyl]-co-[5-(octyloxy)-9,9-diphenylfluoren-2,7-diyl] (PODPF) (lab-synthesised) were made by first dissolving PODPF in chloroform (RCI Labscan) with a concentration of 10 mg ml−1. 60 μl of solutions was dropped onto a pre-cleaned 22 mm × 22 mm coverslip and spin-coated at 1500 rpm for 60 s. Thermally annealed PODPF films were prepared by putting the films on a hot stage at set temperatures (230 and 275 °C) and annealing under slow nitrogen flow for 10 min.
Unlike solution-based measurements, in a microscope configuration the usual terminology of vertical or horizontal, or s- or p-polarised excitation is meaningless. We therefore define the excitation polarisation direction in terms of the x- and y-axes of the microscope stage (Ex and Ey, figure 4), with I|| corresponding to the detection of emission (or transmission) polarised parallel to the polarisation of excitation, and I⊥ to the detection of emission (or transmission) in the orthogonal polarisation direction. Polarisation bias (G-factor) is accounted for in the calculation of the emission anisotropy at each pixel using the anisotropy image acquired from a dilute solution of Rhodamine 6 G in ethanol, assuming rapid and complete depolarisation of emission from this fluorophore. Images acquired through the two time-resolved channels were manipulated using an open-source package called 'Bio-Formats', [29, 30] along with our custom MatLab® code, to generate anisotropy mapping on a pixel-by-pixel basis.
Polarisation transmission images are captured by the transmission detector and compared under different polarised excitations (i.e., Ex and Ey), with no image processing procedures applied.
Results
Previous research [31, 32] has shown that amorphous PODPF films can undergo 'self-dopant' behaviour, transitioning to a more planar and crystalline β-conformation through thermal annealing. By precisely controlling the thermal annealing temperature, the fraction of β-conformation in the film can be tuned [33]. In our previous work [7], we reported on photophysical studies of PODPF using TREM and FAM. However, due to limitations of the available instrument at that time, TREM and FAM had to be conducted separately on different instruments. This led to challenges in linking observed features and accurately interpreting the data, as differences in resolution, optical field of view, and excitation photon fluxes restricted direct comparison of signals. Furthermore, PTI could not be performed simultaneously, so the degree of alignment could not be unequivocally assessed. To overcome these limitations, we have collected TREM, PTI and FAM data simultaneously using the updated TR-FAM apparatus, which significantly reduced ambiguities caused by changing instruments.
Figure 6 shows the TREM and FA results of PODPF films treated under different annealing temperature conditions. The untreated film shows essentially no variation in either the amplitude-weighted average fluorescence decay time [34]  or fluorescence anisotropy (r) on the spatial scales achieved here. The spatial homogeneity and essentially complete emission depolarisation, illustrate the amorphous configuration of the polymer chains suggesting that energy transfer is occurring in domains smaller than the diffraction limit (hundreds of nanometres) (figure 2(c)ii).

Figure 6. TREM (a) and FAM (b) images of PODPF films before annealing (a1, b1) and after annealing at 230 °C (a2, b2), and 275 °C (a3, b3). (c) and (d) are distribution diagrams for the average fluorescence decay time and fluorescence anisotropy of films annealed at different temperature, respectively. Scale bar: 10 μm.
Download figure:
Standard image High-resolution imageHeterogeneity in both τm and r is observed over the films after thermal annealing, and is most noticeable in the film annealed at 275 °C, indicating the formation of domains on the micrometre scale within the film in which the polymer chains adopt different configurations leading to morphology variability. TREM measurements (figures 6(a1)–(a3)) illustrate that the τm gets shorter after thermal annealing and decreases further with increasing annealing temperature. The τm distribution (figure 6(c)) also broadens a little with increasing annealing temperature, reflecting the heterogeneity. The FA images (figures 6(b1)–(b3)) illustrate a more marked increase in heterogeneity across the films with increasing annealing temperature. Thermal treatment at 230 °C results in an increase, but little broadening, in anisotropy values compared to the untreated film, however, the sample treated at 275 °C shows a broad anisotropy distribution (figure 6(d)). The higher fluorescence anisotropy values represent diminished emission depolarisation existing in these films, and the breadth of the distribution illustrates that this depolarising process is not uniform across the sample. The increase of maximum anisotropy value with higher temperature also suggests that chromophores tend to be more aligned, which is concordant with what is expected with β-phase formation. This more complicated film morphology is attributed to a wider distribution of chain conformations, and perhaps regions of higher molecular order.
The dramatic change in the morphology in the film annealed at 275 °C compared to the other conditions may be related to either (or both) the glass transition or melting temperature/s of the polymer. Differential Scanning Calorimetry (DSC) of PODPF has been performed, and a typical heating and cooling curve (figure S1) shows a clear transition feature close to 275 °C on heating and a less pronounced feature at ∼200 °C on cooling. The glass transition temperature of a polymer (Tg) is lower than the melting point. A glass transition does not involve a phase change whereas melting does, and glass transition only occurs in amorphous polymers or the amorphous portion of a polymer. Only crystalline polymers can undergo a melting phase change. Glass transition temperatures of poly(fluorenes) are difficult to observe, whereas for oligofluorenes the Tg is typically in the range 250 °C–350 °C [35]. The film annealed at 275 °C may have experienced both some melting and glass transition, whereas the film annealed at 230 °C presumably only exceeded the glass transition temperature. Glass transition and/or melting could lead to increased freedom of the chains to change alignment and chain conformations, supported by figure 7.

Figure 7. Excitation–emission spectral matrices of (a) untreated PODPF films and (b) after thermal annealing at 275 °C for 10 min.
Download figure:
Standard image High-resolution imageTaking advantage of the ability to conduct simultaneous multi-modal measurements on the same instrument, features on the TREM images and anisotropy images can be compared. There is a correlation between the different regions exhibiting given τm and anisotropy values. Regions of short τm in the TREM images mostly correspond to higher fluorescence anisotropy values. Two possibilities may explain/contribute to this. Firstly, according to a previous study based on MEH-PPV oligomers [36], longer conjugation lengths in a polymer exhibit shorter τm values compared to short conjugation length segments. In the present case of PODPF films, since thermal annealing can induce the formation of more crystalline structures, overall chain conjugation lengths may therefore be increased, leading to shorter average decay times. Excitation/emission matrices of these films (figure 7) reveal red shifts in both the excitation and emission spectra for the thermally annealed films compared to the unannealed film, as expected for an extension of average conjugation lengths based on a simple particle-in-a-1D box interpretation. Secondly, with the formation of a more ordered structure, transition dipole moments of chromophores are more aligned, favouring both intra- and inter-molecular energy transfer processes channelling excitation energy to lower energy (i.e. longer conjugation length) units, again leading to shorter fluorescence decay behaviour and the observed red-shift in emission. As explained in figure 2(b)ii, energy transfer among at least partially aligned polymer segments can result in fluorescence anisotropy values greater than zero.
These observations are broadly in line with our previous studies in which heterogeneity in fluorescence anisotropy was attributed to changes in the efficiency of energy migration caused by conformational variability [7, 37–39]. However, while TREM and FAM individually provide valuable information about the photophysical behaviour within the films, they cannot unequivocally report on the degree of excitation energy migration or chromophoric alignment. This is because, as shown in figure 2, excitation energy migration may be efficient in: (i) a well aligned region without leading to significant emission depolarisation, (ii) a reasonably aligned condition with moderate emission depolarisation or (iii) a randomly oriented system leading to low/zero anisotropy. PTI can be used as a powerful complementary tool to further confirm the polymer conformational and alignment heterogeneity. The Ex and Ey polarised transmission maps should be identical and featureless for an amorphous sample, whereas there should be clear regions of contrast in a PT map from samples with resolvable regions of well-aligned chromophore absorption transition dipole moments. The fluorescence anisotropy images of a well-aligned sample should also show contrasting behaviour when recorded under Ex and Ey excitation conditions.
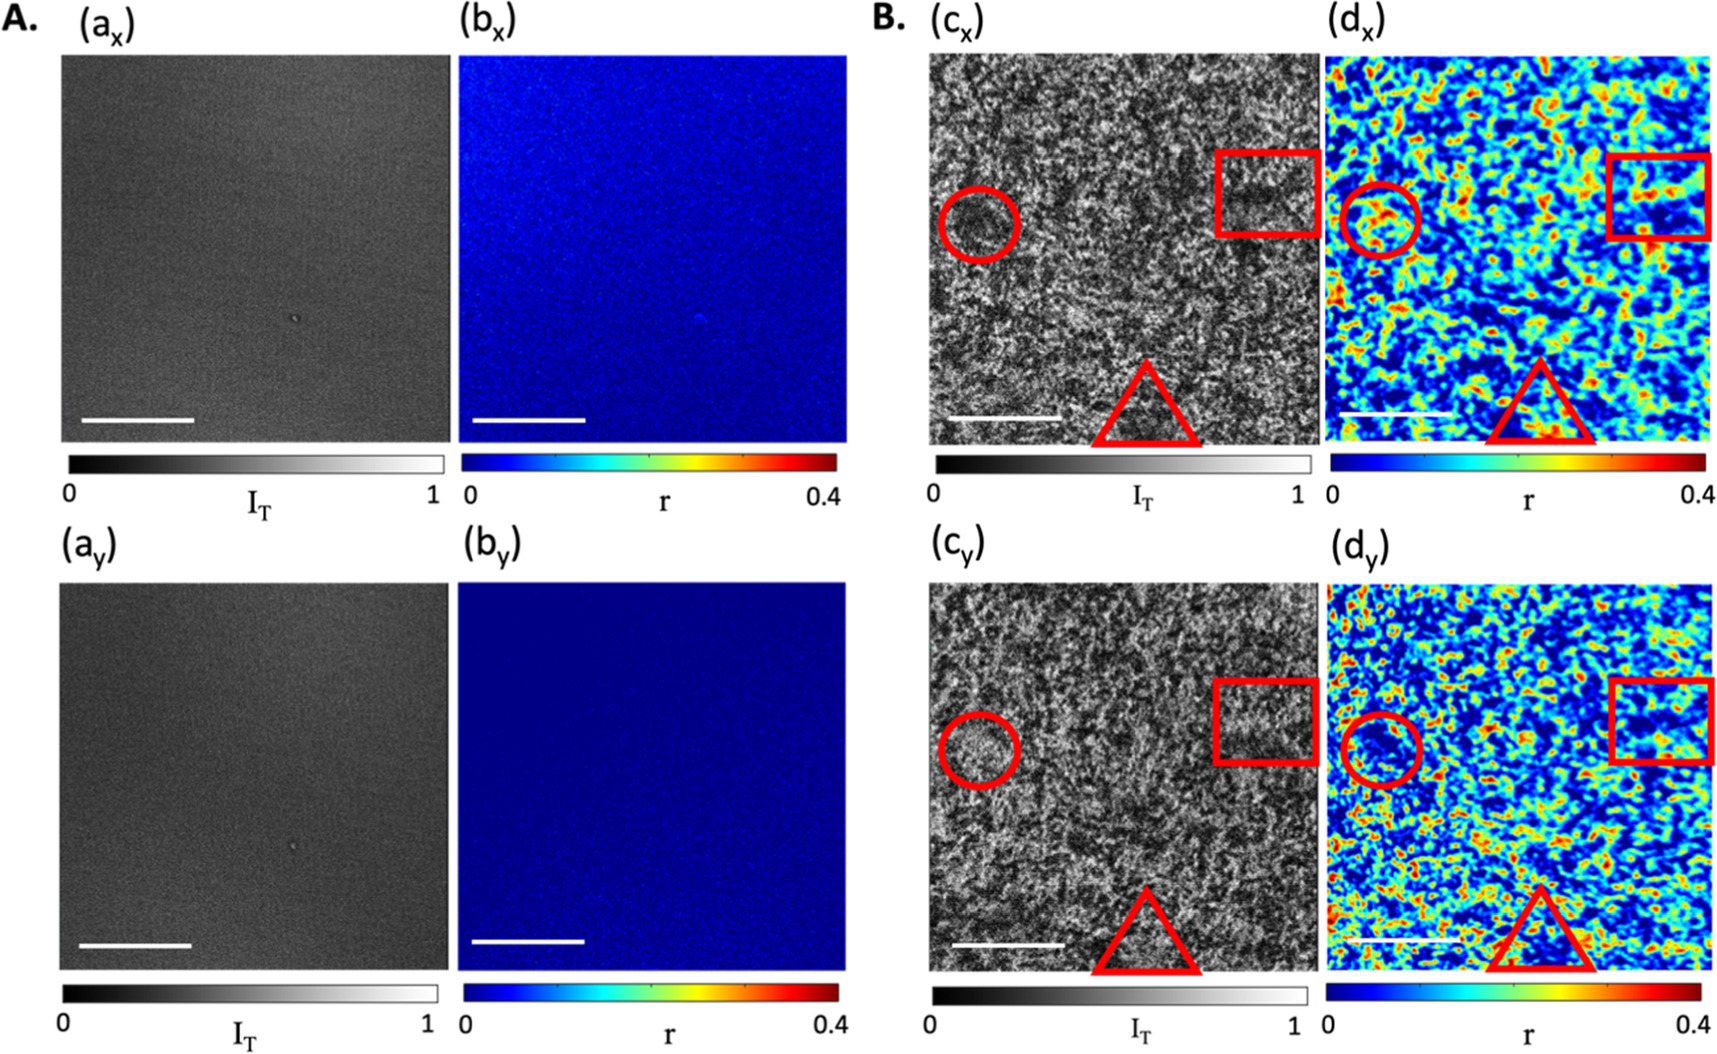
Polarised transmission and fluorescence anisotropy images of the untreated PODPF film and after annealing at 275 °C have been recorded under orthogonally polarised incident light conditions (figure 8). For the untreated film (figure 8(A)), a homogenous film morphology is observed in both the polarised transmission images (ax and ay) and fluorescence anisotropy (bx and by) maps, thereby exhibiting no preference of chromophoric alignment. While the featureless images and low emission anisotropy values confirm the amorphous chain conformation in the untreated film (figure 8(A)), for the annealed film (figure 8(B)), heterogenous film morphology and obvious contrast are again observed, in both the PTI and FA maps. It is worth noting that the features reported under x- and y-polarised illumination (Ex and Ey) are mostly reversed in both the transmission (cx and cy) and anisotropy (dx and dy) images (as illustrated in the regions marked by various shapes), confirming the existence of various reasonably ordered micrometre-sized regions with different orientations, indicating that domains of more crystalized β-phase PODPF are distributed on the films. This is further illustrated by the images representing the difference between the images of the two excitation polarisation directions comparing the pristine and 275 °C annealed films (figure S2). Domains with higher fluorescence anisotropy values generally correspond to darker regions on the corresponding transmission image, indicating the presence of regions in which the chromophores are aligned somewhat parallel to the excitation electric field. The combination of FA and PTI therefore suggests that in these more crystalized β-phase regions (those with 0<r<0.4) EEM is efficient due to reasonably favourable alignment of the chromophore segments, but not result in complete depolarisation of emission (corresponding to scenario (b)ii in figure 2). The regions of low/zero anisotropy values associated with the brighter regions in the PTI therefore correspond to scenario (c) in figure 2 where a disordered/amorphous morphology dominates, but presumably with EEM still occurring. There are also other regions that do not have a clear correlation between chromophore alignment and emission anisotropy, which along with the breadth of the anisotropy histogram, suggests the presence of some chromophoric units undergoing EEM (low anisotropy values) and others little EEM (high anisotropy).
Figure 8. Polarised transmission images (a), (c) and fluorescence anisotropy maps (b), (d) of PODPF films, recorded simultaneously. (A): untreated PODPF film; (B): film after annealing at 275 °C for 10 min. Both films were illuminated under x- and y-polarised beams for comparison. Regions with typical features are outlined in identical shapes for direct comparison. Scale bar = 10 μm.
Download figure:
Standard image High-resolution image
Conclusion
This study highlights the importance of characterising the alignment of chromophores in thin-film semiconducting materials to fully interpret their photophysical behaviour in thin films. The development of a practical approach, in which polarised transmission images are recorded concurrently with time-resolved and fluorescence anisotropy maps, has been demonstrated as a powerful tool for investigating chromophore conformation and alignment through its application to PODPF films. The time-resolved emission images can be correlated to the fluorescence anisotropy, and PTI directly maps the distribution of the absorption dipole moments of fluorophores, enabling a more reliable and explicit assessment of chromophore alignment, enabling the fluorescence anisotropy images to be interpreted in terms of excitation energy migration.
The results from the combination of the three modes of microscopy, TREM, FA and PTI, suggests that the micron-sized morphological features in PODPF correspond to domains in which the polymer adopts a more crystalised configuration upon thermal annealing, which influences the fluorescence decay characteristics, and both factors contribute to the recorded fluorescence anisotropy value as a function of location. There are still ambiguities concerning the efficiency of EEM and the addition of hyperspectral capabilities to the microscope would further enhance the ability to probe if EEM to low energy (red emitting) chromophores is efficient.
This combination of complementary techniques offers a significant advancement in the field of characterising chromophore alignment in thin-film semiconducting materials. This integrated approach overcomes limitations associated with using fluorescence anisotropy alone and its ability to directly visualize domains with oriented absorption transition dipoles provides valuable information for understanding the structure–property relationships governing these materials, opening avenues for future research in optimizing the properties of thin-film semiconductors for various optoelectronic applications.
Acknowledgments
This work was supported by the ARC Centre of Excellence in Exciton Science (CE170100026). Y X acknowledges support from The Albert Shimmins Fund from The University of Melbourne (CRICOS: 00116K). The authors have declared that no conflicting interests exist.
Data availability statement
All data that support the findings of this study are included within the article (and any supplementary files).
Supplementary data (1.8 MB PDF)