
Abstract
Lanthanide-doped fluoride nanocrystals (NCs) exhibit excellent optical features, including upconversion and downconversion luminescence (UCL and DCL), that can be utilized in a variety of applications. In this study, we have successfully demonstrated the photoluminescence behavior of triple-doped NaYF4: Yb3+, Er3+, Pr3+ NCs in the Vis-NIR region. Herein, highly monodisperse hexagonal phase NaYF4: Yb0.2, Er0.02, Prx nanocrystals in various Pr3+ (x = 0, 0.1, 0.5, and 1 mol %) concentration with ∼22 nm diameter synthesized by thermal decomposition technique. The photoluminescence studies for all samples were performed under 980 nm laser excitation. The luminescence intensity of Er3+ including blue (407 nm), green (520 and 540 nm), red (654 nm), and near-infrared (845 nm and 1530 nm) emissions was significantly quenched and Pr3+ emission intensity at 1290 nm (Pr3+:1G4→3H5) changes irregularly upon doping with Pr3+ ions. Furthermore, we performed the excitation power dependence and decay time analysis to investigate the energy transfer and upconversion mechanisms of samples. These findings indicate that the presence of praseodymium strongly reduces emission intensities due to abundant cross-relaxation channels. In addition, particle size is an efficient factor, shedding light on the influence of Pr3+ on the energy transfer and upconversion mechanisms of the fluorides.
Export citation and abstract BibTeX RIS

Original content from this work may be used under the terms of the Creative Commons Attribution 4.0 licence. Any further distribution of this work must maintain attribution to the author(s) and the title of the work, journal citation and DOI.
1. Introduction
Near-infrared emitted upconversion nanoparticles (UCNPs) are remarkably focused on today's technologies, specifically in optical and biotechnological applications. UCNP nanoparticles, when exposed to low energy radiation (NIR), such as low-cost and readily available lasers, usually release higher energy in the visible and NIR region. The near-infrared (NIR) spectrum (700–1700 nm) has captivated considerable interest owing to having extraordinary features, including low autofluorescence and scattering, significant anti-stoke shift, long photoluminescence lifetime, minimum toxicity, and high penetrability into various materials [1, 2]. Owning to defined characteristics, UCNPs have the potential to include lasers [3], displays [4], solar cells [5], optical fiber amplifiers [6], and biological applications such as intracellular signaling, and NIR-II-based deep-tissue bioimaging [7, 8].
Despite huge studies in UCNPs, a big challenge for nanoparticles remains to achieve high-intensity emission in the NIR region. Clarifying this issue requires a deep investigation of various factors such as the host material, crystal structure, dopant type, and dopant concentration present in nanoparticles. Among the host materials, the beta phase of NaYF4 is well known to be an efficient host due to its low phonon energy and has been extensively studied in numerous upconversion luminescence applications [9]. To achieve NIR emission, dopant ions like Yb3+, Er3+, Nd3+, and Pr3+ are frequently employed. Notably, Ytterbium ions exhibit an impressive absorption cross-section under NIR radiation (980 nm); therefore, many studies utilized Yb3+ as a promising choice for sensitized luminescence [10, 11]. For instance, Dai et al successfully developed ultra-bright nanoparticles doped with Er3+ for non-invasive imaging of cancer immunotherapy in a second near-infrared window [12]. In another study, Nd3+ was used as a doping ion in β-NaYF4 microcrystals, and near-infrared emission was observed at 1058 nm with 4F2/3→4I11/2 transition [13]. In addition to the studies carried out with Er3+ and Nd3+ ions to obtain near-infrared emission, Pr3+ is another alternative dopant ion as reported by Ruiz-Caridad et al who demonstrated a near-infrared emission at 1350 nm emission under 1020 nm excitation in Pr-doped Y2O3–ZrO2 crystals [14]. Although many studies focused on a single type of lanthanide doping, as mentioned above, many researchers have investigated the optical properties of co-doped or triple-doped materials to overcome the quenching effect encountered at high doping concentrations [15].
Among the rare-earth elements, (Pr3+) and (Er3+) are attractive candidates for emission in the NIR region, especially in the 1300 and 1550 nm ranges, respectively [16]. However, due to the electron configuration of the Pr3+, enhancing the emission of f-f transitions is often challenging [17]. Therefore, Er3+ can be a feasible alternative for decreasing the cross relaxation-induced quenching of Pr3+ near-infrared emission [1D2, 3H4] [1G4, 3F3,4] [18]. Mostly glasses and crystals co-doped with Pr3+/Er3+ appear to be relatively suitable candidates for broadband near-IR luminescence. In particular, the Pr3+ and Er3+ ions can emit light in the range of 1200 to 1650 nm, via transitions such as 1G4→3H5 (Pr3+), 1D2→1G4 (Pr3+), and 4I13/2→4I15/2 (Er3+) in fluoridated glass [19]. Furthermore, Pr3+ and Yb3+ co-doped nanoparticles have been applied for near-infrared bioimaging and antibacterial effects [20]. In another application, a highly efficient quantum-cutting process was observed from the Pr3+/Yb3+ co-doped NaYF4 nanocrystals, converting one high-energy visible photon into two or more low energy near-infrared photons [21].
So far, trivalent Pr3+ and Er3+ ions have been co-doped with different host structures to obtain a broad emission band in the near-infrared region. Se Ho Park et al introduced Pr3+/Er3+ co-doped Ge-As-Ga-S glasses, investigating fluorescence emissions in the 1.31 and 1.55 μm communication windows. Their work showed that the lifetime of the Pr3+:1G4 level rose with increasing Er3+ concentration, whereas that of the Er3+: 4I11/2 level declined. Doped Ge-As-Ga-S glasses, containing Pr3+ and Er3+ exhibit great promise as amplifier materials [22]. Ho Kim Dan et al examined energy transfer (ET) and NIR emission from Pr3+, Er3+, Yb3+ tri-doped niobate tellurite glass (TeO2-Nb2O5-BaO-La2O3), resulting in broadband NIR spectrum from 1250 to 1650 nm, with a full-width half maximum (FWHM) of ∼ 300 nm. It was found that enhancing Yb3+ concentration strengthens the NIR emissions. These findings suggest that the niobate tellurite glass (TeO2-Nb2O5-BaO-La2O3) material has the potential to be used in optical fiber amplifiers (OFAs) [23]. Furthermore, Bo Zhou et al, demonstrated for the first time that praseodymium (Pr3+), and erbium (Er3+) codoped fluorotellurite glasses emit in a super broadband range, covering 1.30 to 1.68 μm under 488 nm illumination. The results indicate that fluoro tellurite glass doped with Pr3+ and Er3+ is a promising material for applications in optical amplification, tunable lasers, and super broadband amplified spontaneous emission sources [16]. Additionally, triple-doped NaYF4 nanoparticles with the Yb3+, Er3+, and Pr3+ combination were reported to probe the white light upconversion luminescence [18]. Under 980 nm excitation, a nanoparticle co-doped with Yb3+, Er3+, and Pr3+ exhibited a combination of emissive modes peak at 1320 nm, and 1530 nm belonging to Pr3+ and Er3+ emission, respectively. Meanwhile, Er3+ was also used to promote near-infrared emission which may be employed for NIR DCL bioimaging in the NIR-II window of biological tissue transparency [24]. These studies collectively highlight the potential of various doping combinations and host materials in achieving efficient near-infrared emission and advancing the development of optical amplification and other related applications.
The present research aims to evaluate the influence of Pr3+ dopants on photoluminescence properties under a 980 nm excitation laser. We employed NaYF4 nanocrystals doped with Er3+ and Pr3+ concentrations (≤1 mmol %). The Pr3+ ion was selected as the Er3+ and Pr3+energy levels are in resonance with one another, leading to an enhanced probability of cross-relaxation due to the broad range of energy levels. To the best of our knowledge, our study represents the photoluminescence behaviour of NaYF4: Yb3+, Er3+, Pr3+ in various Pr3+ concentrations that resulted in emissions in both the VIS and NIR regions. The required analysis was performed on samples such as absorbance spectra, decay time measurements, and power dependence studies for the first time.
2. Experimental procedures
2.1. Chemicals
Following chemicals were used as received without further purification. 99.9%; Y(CH3CO2)3·x H2O, 99.9%; Yb(CH3CO2)3·xH2O, 99.9%; Er(CH3CO2)3·xH2O, 99.9%; Pr(CH3CO2)3· xH2O, >98%; NaOH, >98%; NH4F, 90%; 1-octadecene, 90%; oleic acid, 99%;ethanol, 99.8%; methanol and Cyclohexane were purchased from Sigma-Aldrich.
2.2. Synthesis of β-Phase NaYF4: Yb3+, Er3+, Pr3+ nanoparticles
The hexagonal structure nanoparticles, β-NaYF4 co-doped with Pr3+, Er3+, and Yb3+ions were synthesized following the standard thermal decomposition technique based on a protocol that has been reported in detail [25]. First, (1 mmol) of aqueous lanthanide acetate Ln (CH3CO2)3 (Ln= Y3+, Yb3+, Er3+, Pr3+) was prepared and dissolved in 6 ml oleic acid (OA), and 15 ml octadecene (OCDE) under 150 °C heating for 30 min while stirring to form a clear, homogenous solution. After the reaction was completed the reaction temperature was lowered to 60 °C then a methanol solution of ammonium fluoride (2.5 mmol) and sodium hydroxide (4 mmol) was added slowly to the solution. In the following process, the reaction temperature was increased to 110 °C and the obtained mixture was maintained at 110 °C under a vacuum for the completion of methanol evaporation. In the final step, the reaction temperature increased to 300 °C and kept for 90 min under an inert atmosphere. After the process is completed, the mixture is cooled to room temperature and nanocrystals are precipitated followed by ethanol and cyclohexane several times and collected by centrifugation. After the washing process was completed, the obtained pellets were dispersed in cyclohexane. This procedure was performed for the synthesis of hexagonal structure nanoparticles; the samples were prepared with the different mole percentages NaYF4: 20%Yb3+, 2%Er3+, x % (x = 0, 0.1, 0.5, 1) Pr3+.
2.3. Measurement and characterization
The x-ray powder diffraction (XRD) BRUKER D-8 ADVANCE, employing Cu Kα radiation (λ = 1.54 A°), 40 kV–40 mA at room temperature, is utilized for evaluation of crystal structures and phase purities of samples. Transmission electron microscopy (TEM) was performed with a device model JEM-2100-PLUS to characterize the size and morphology of samples. The high-resolution TEM (HRTEM) was recorded using an instrument model Talos L120C. The optical absorption spectra of samples were carried out with a UV/VIS spectrometer model PerkinElmer model LAMBDA35 with a wavelength range between 190–1100 nm at room temperature. Photoluminescence (PL) spectra of the synthesized UCNPs were characterized by the Horiba FluoroLog-QM spectrofluorometer with a continuous wave NIR diode laser (980 nm). The spectrofluorometer featured a 75 W xenon arc lamp, an R928P photomultiplier tube (PMT) with a detection limit of 250–850 nm, and an InGaAs detector (measurement range, 800–1700 nm). The fluorescence decay curves were recorded, using a pulsed light source (980 nm) incorporated into a regular Fluorolog-QM and utilizing the standard SSTD mode to measure phosphorescence lifetimes.
3. Results and discussion
3.1. Structural analysis
In this study, the NaYF4:Yb3+, Er3+ UCNPs were synthesized by thermal decomposition technique. The UCNPs were then characterized by XRD and TEM, respectively. The XRD patterns for different dopant concentrations of Pr3+ in the NaYF4:Yb3+, Er3+ matrix demonstrated the pure single-phase hexagonal structure nanoparticles. For the sake of brevity and clarity, the experimental parameter such as dopant ion concentration is listed in table 1 and the samples have been appropriately labelled in the figures.
Table 1. Labelled experimental parameters for dopant ion concentration.
| Samples'code | Yb3+ concentration (mol %) | Er3+ concentration (mol %) | Pr3+ concentration (mol %) |
|---|---|---|---|
| 20Yb2Er | 20 | 2 | 0 |
| 20YbEr0.1Pr | 20 | 2 | 0.1 |
| 20Yb2Er0.5Pr | 20 | 2 | 0.5 |
| 20Yb2Er1Pr | 20 | 2 | 1 |
| 20Yb1Pr | 20 | 0 | 1 |
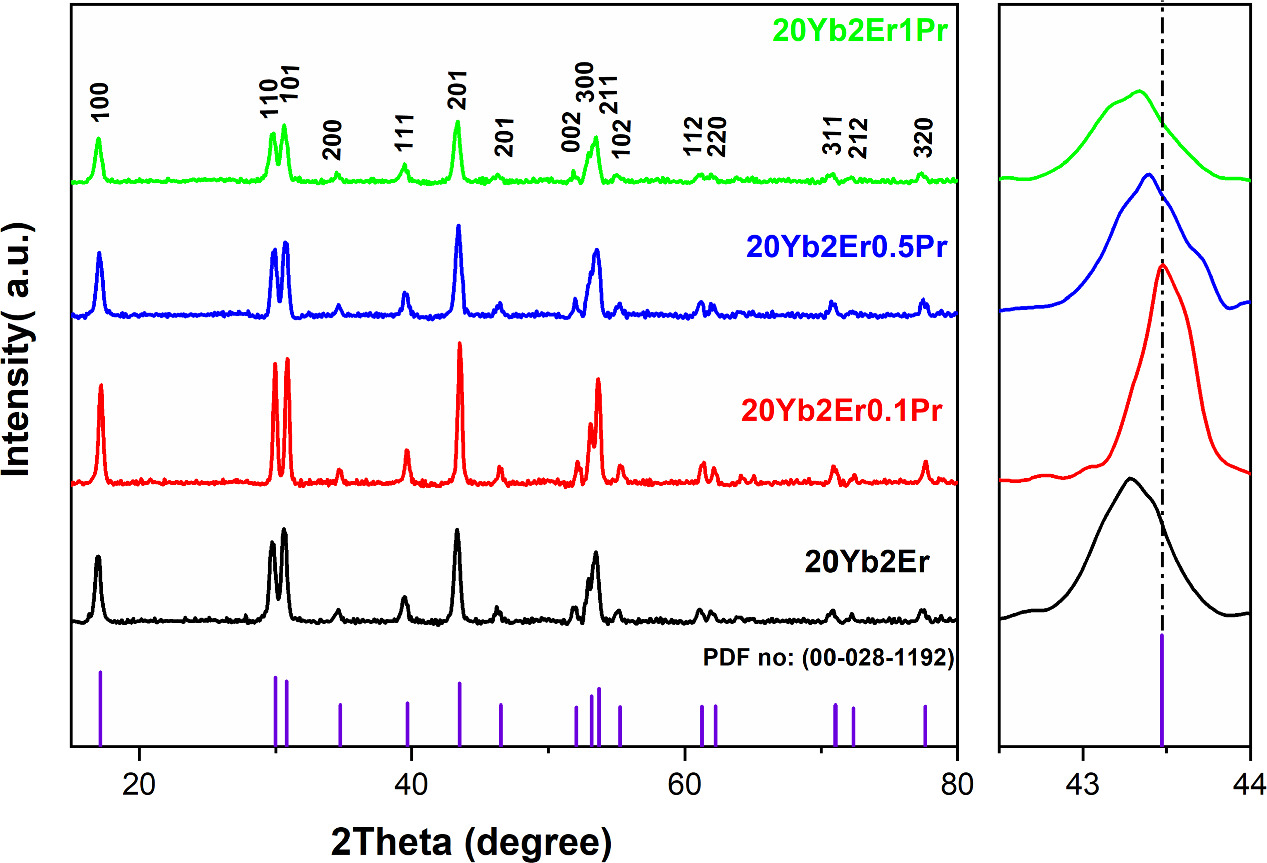
The normalized XRD pattern of samples is shown in figure 1. The diffraction peaks of samples matched with a slight shift to the standard card of hexagonal Na(Y0.57Yb0.39Er0.04) F4 (reference code: 00-028-1192) with the lattice constants of a = b = 5.960 Å, c = 3.510 Å, α = β = 90 °C, γ = 120 °C. The XRD results confirmed the crystallinity and phase purity of samples that remained unchanged despite various doping concentrations of Pr3+ ions.

Figure 1. X-ray diffraction patterns of NaYF4: Yb0.2, Er0.02, Prx nanostructures with varied concentrations of Prx (x = 0%, 0.1%, 0.5%, 1%) ion doping and a selected region of peak shifts.
Download figure:
Standard image High-resolution imageStudies also reported lanthanides due to their comparable ionic radii can be substituted for one another in crystalline host matrices; they can also be added in various combinations and introduced in varying concentrations without significantly altering the crystal structure [26]. Since the ionic diameters of Pr3+ (1.82 Å) and Y3+(1.80 Å) are similar, and the valence of Pr3+ and Y3+ are the same, Pr3+ can substitute for the Y3+ sites [27].
In order to reveal the subtle differences caused by Pr3+ doping, a selected region of diffraction peaks is magnified and marked by a rectangle in figure 1. The magnified XRD pattern of the NaYF4: Yb3+, Er3+, Pr3+ samples exhibited peak shift towards smaller angle compared to the reference pattern, which can be attributed to the smaller particle size. The XRD peaks widened and shifted slightly; the broadening concerns the decrease in particle size, whereas the shift can be attributed to alter in the crystal lattice [28]. The difference in particle size observed in the 0.1% Pr3+ sample compared to the other samples can be attributed to the potential differences in the colloidal synthesis process across different experiments.
Moreover, the Scherer formula can be used to determine the size of the grain based on the diffraction width peak, though the average nanocrystalline sizes were determined by applying the Scherrer formula (equation (1)) to the XRD spectra shown in table 2. Furthermore, no correlation was found between the Pr3+ concentration and the average particle size of the samples.

Table 2. The average particle size of samples in different Pr3+ concentrations doped in NaYF4. Using the Scherrer equation and TEM observations.
| Sample | Average crystallite size (nm) Scherrer's Method | Average particle size (nm) TEM analysis |
|---|---|---|
| 20Yb2Er | 18.53 | 23.66 |
| 20Yb2Er0.1Pr | 22.65 | 31.08 |
| 20Yb2Er0.5Pr | 17.09 | 21.18 |
| 20Yb2Er1Pr | 18.75 | 22.48 |
3.2. Morphology and size distribution
The Morphology and size distribution of samples (NaYF4: Yb0.2, Er0.02, Prx) were studied by transmission electron microscope (TEM). In figure 2, the TEM image and size distribution related to NaYF4: Yb3+, Er3+ doped nanoparticles are demonstrated with a different dopant ion concentration of Pr3+, as shown in figures 2(a)–(h). The average size of nanoparticles was achieved at around 22 nm. The results confirmed that the TEM analysis is roughly consistent with the XRD average particle size calculations. Moreover, the high-resolution TEM (HRTEM) image and the Fast Fourier-transformation (FFT) of the nanoparticle result proves the pure single-crystalline structure with a uniform lattice fringe and a d-spacing of 0.53 nm, which corresponds to the d-spacing for the (110) and (100) lattice planes of the beta phase NaYF4, as depicted in figure 2(i). In particular, the formation of a perfect hexagonal close-packed (HCP) structure of triple-doped NaYF4 nanoparticles was confirmed by the selected area electron diffraction (SAED), shown in figure 2(j).

Figure 2. TEM image of the samples (left) and size distribution histograms for the samples with a Gaussian-fitting curve (right, solid line): 20Yb2Er (a) and (b), 20Yb2Er0.1Pr (c) and (d), 20Yb2Er0.5Pr (e) and (f), 20Yb2Er1Pr (g) and (h). (i) High-resolution pattern of 20Yb2Er nanocrystals. (j) SAED pattern of 20Yb2Er sample nanocrystals.
Download figure:
Standard image High-resolution imageThe comparison in particle sizes calculated by the Scherer formula from the XRD result and size distribution of TEM observations are given in table 2. Scherrer equation provides an estimate of the crystallite size in the sample, which is smaller than the nanoparticle size because nanoparticles are often agglomerations of many crystallites. Therefore, the size distribution of the nanoparticles observed by TEM is larger than the crystallite size calculated by the Scherrer equation [29].
3.3. Optical properties
3.3.1. Absorption spectra
The absorption spectra were utilized to confirm the presence of pure Yb3+, Er3+, and Pr3+ dopants and to understand the energy levels and transitions in Yb3+, Er3+, Pr3+ triple-doped NaYF4 samples, thereby providing valuable information about the electronic structure of the material. A Perklin-Elmer UV–vis-NIR Lambda 35 spectrophotometer was used to collect the optical absorption spectra. The powder samples were placed and examined in a sample holder with a quartz window. The range of wavelengths that were measured fell within the spectrum of 190 nm to 1100 nm. The absorption spectroscopy for the Yb3+, Er3+, Pr3+ triple doped NaYF4 samples were investigated with and without Er3+ dopant. The absorption spectra of samples 20Yb1Pr and 20Yb2 Er1Pr are shown in figure 3.

Figure 3. Absorption Spectra of NaYF4:Yb3+ Pr3+ and/ or Er3+ nanoparticles (Inset represents higher resolution spectra in 400–850 nm region).
Download figure:
Standard image High-resolution imageThe intense peak at 976 nm is common for both spectra and originates from 2F5/2→2F7/2 absorption of Yb3+. For the blue lined spectrum (20Yb1Pr), the absorption bands located at 445, 469, 483, 587 nm correspond to the transitions from the ground state 3H4 to specific excited states 3P2, 1I6 + 3P1, 3P0 and 1D2 of Pr3+, respectively. For the red lined spectrum (20Yb2Er1Pr), in addition to the aforementioned transitions belonging to the Pr3+ the absorption bands located at 520, 540, and 654 have been observed, which can be assigned to 2H11/2→4 I15/2, 4S3/2→4I15/2, and 4F9/2→4I15/2 transitions of Er3+, respectively [30].
3.3.2. Upconversion and down conversion spectra
Figure 4 exhibits the visible and near-infrared emission spectra of NaYF4: Yb3+, Er3+, Pr3+ nanocrystals excited by a 980 nm laser diode. Emission spectra in the visible region were observed at 377, 407, 465, 488, 520, 540, and 654 nm, which can be attributed to specific transitions of Er3+energy levels such as 4G11/2→4I15/2, 2H9/2→4I15/2, 4F5/2→4I15/2, 4F7/2→4I15/2, 2H11/2→4I15/2, 4S3/2→4I15/2, and 4F9/2→4I15/2, respectively (inset figure 4). When Pr3+ ions were doped into the 20Yb2Er sample, all peak intensities were quenched with the increase in the Pr3+ dopant concentration, shown in figure 4. However, no emission peaks belonging to Pr3+ ions were observed at the visible region originating from the 3P0,1→3H4–6, 3F2–4,1D2→3H4 transitions [31].
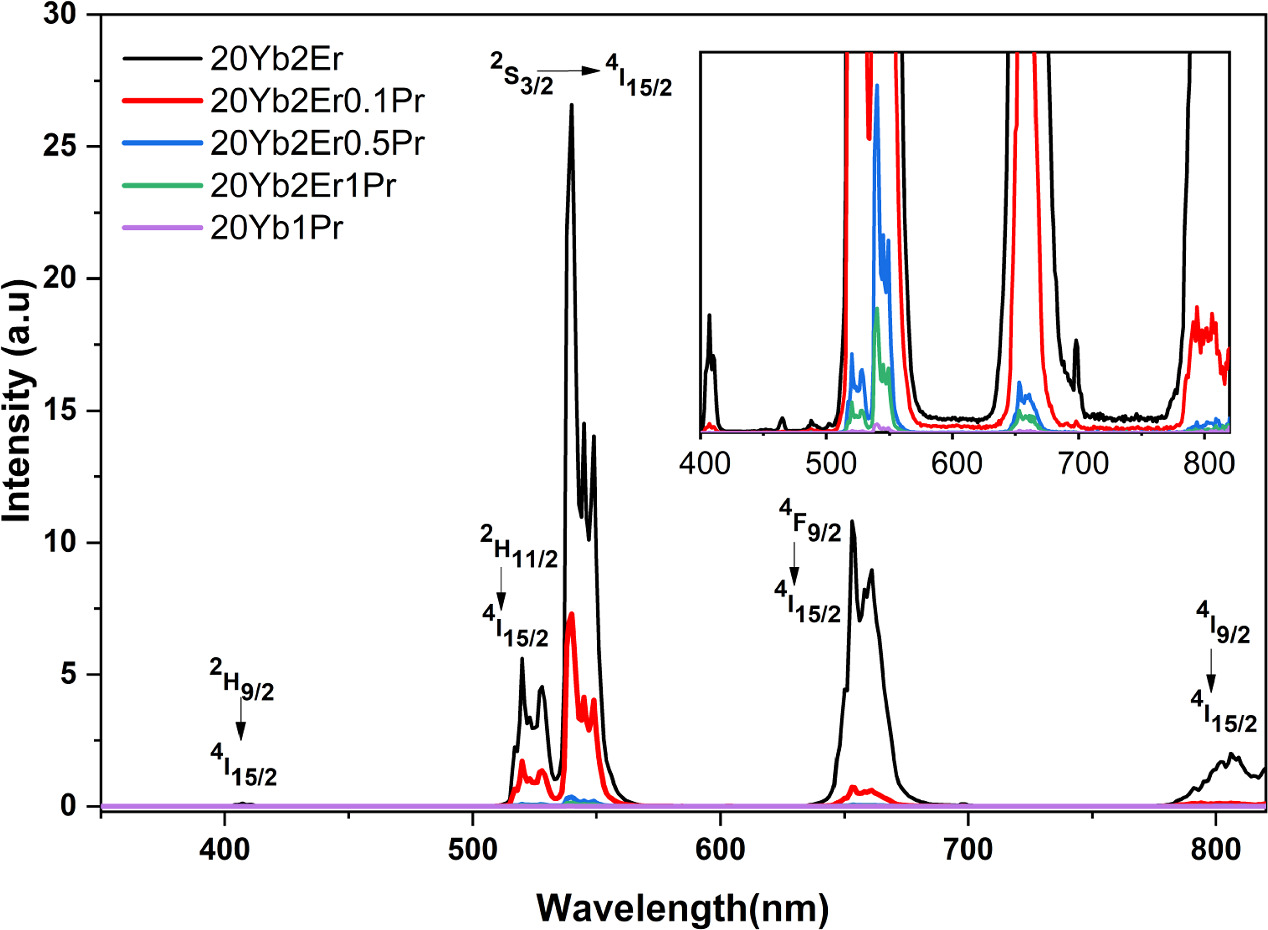
Figure 4. Upconversion photoluminescence emission spectra of nanoparticles under 980 nm laser excitation in the visible region, where all discernible peaks are exclusively attributed to Er3. (Inset presented high-resolution region).
Download figure:
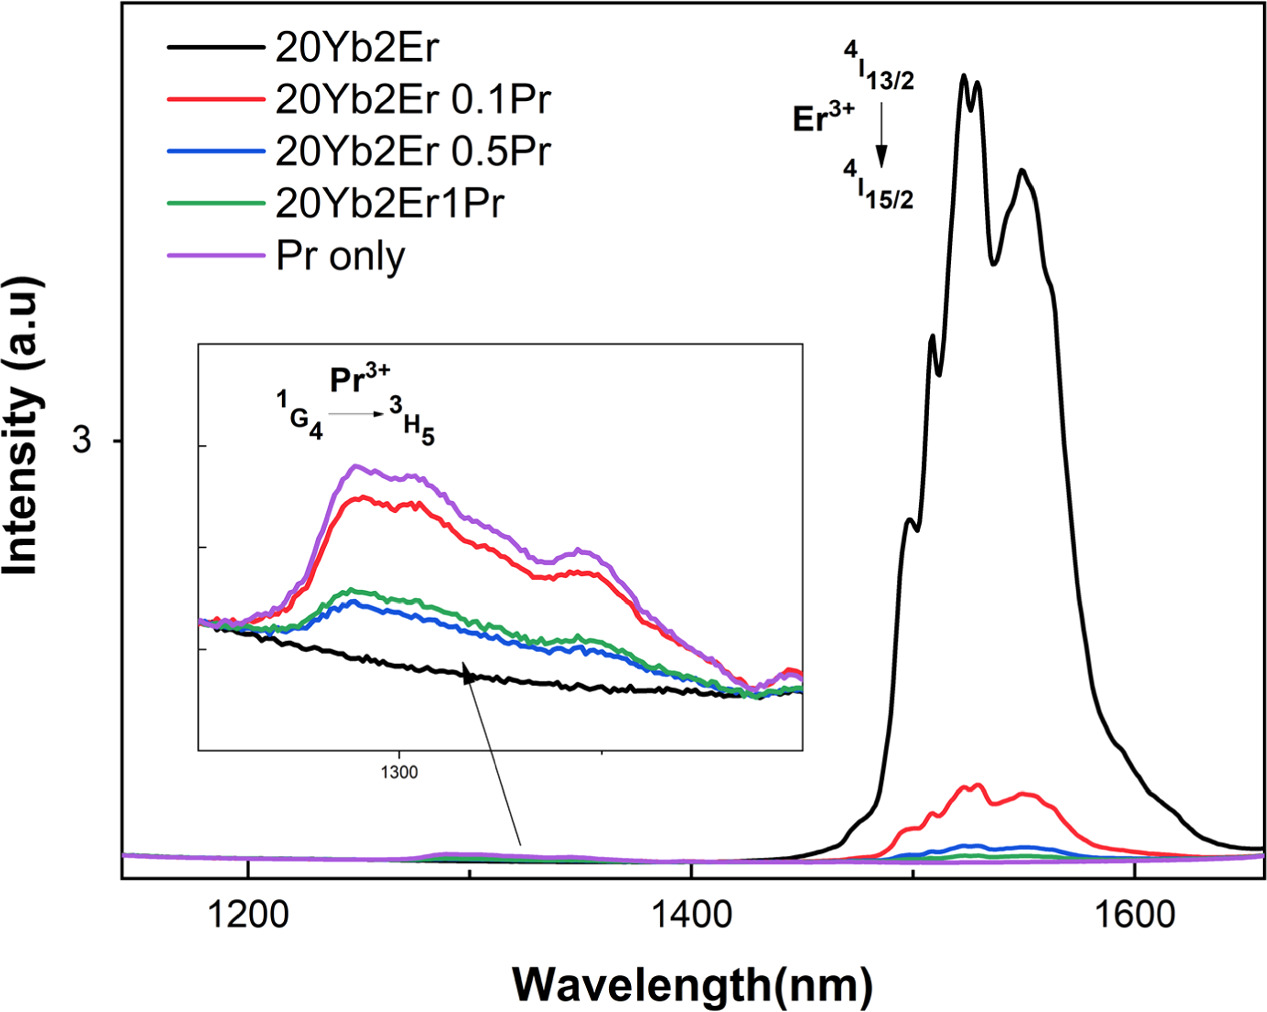
Standard image High-resolution imageIn the NIR region, depicted in figure 5, the luminescence intensity at 1530 nm (Er3+:4I13/2→4I15/2) was significantly quenched and weak emission intensity at 1290 nm (Pr3+:1G4→3H5) changes irregularly upon doping with Pr3+ions. It is evident that in the population of 4I13/2 and 1G4 levels, cross relaxations seem to be the main process affecting the emission from these levels.

Figure 5. Near-infrared photoluminescence emission spectra of nanoparticles under 980 nm laser excitation.
Download figure:
Standard image High-resolution image3.3.3. Power dependence of upconversion luminescence
In order to comprehend the upconversion mechanism of our samples, we analyzed the excitation power dependence of UC emission intensities for NaYF4: Yb3+, Er3+, Pr3+ samples excited at various pump powers using the 980 nm diode laser and the pump power dependent upconversion luminescence spectra are recorded, either for emissions in visible or NIR regions, as depicted in figures 6 and 7, respectively. The relation between upconversion emission intensity and excitation power was established using equation (2),

Where I is the emission intensity, P is the power of excitation and n is the number of photons involved in the upconversion process. The value of n can be ascertained by analyzing the slope value of a linear fitting in a logarithmic-logarithmic plot of equation (2).

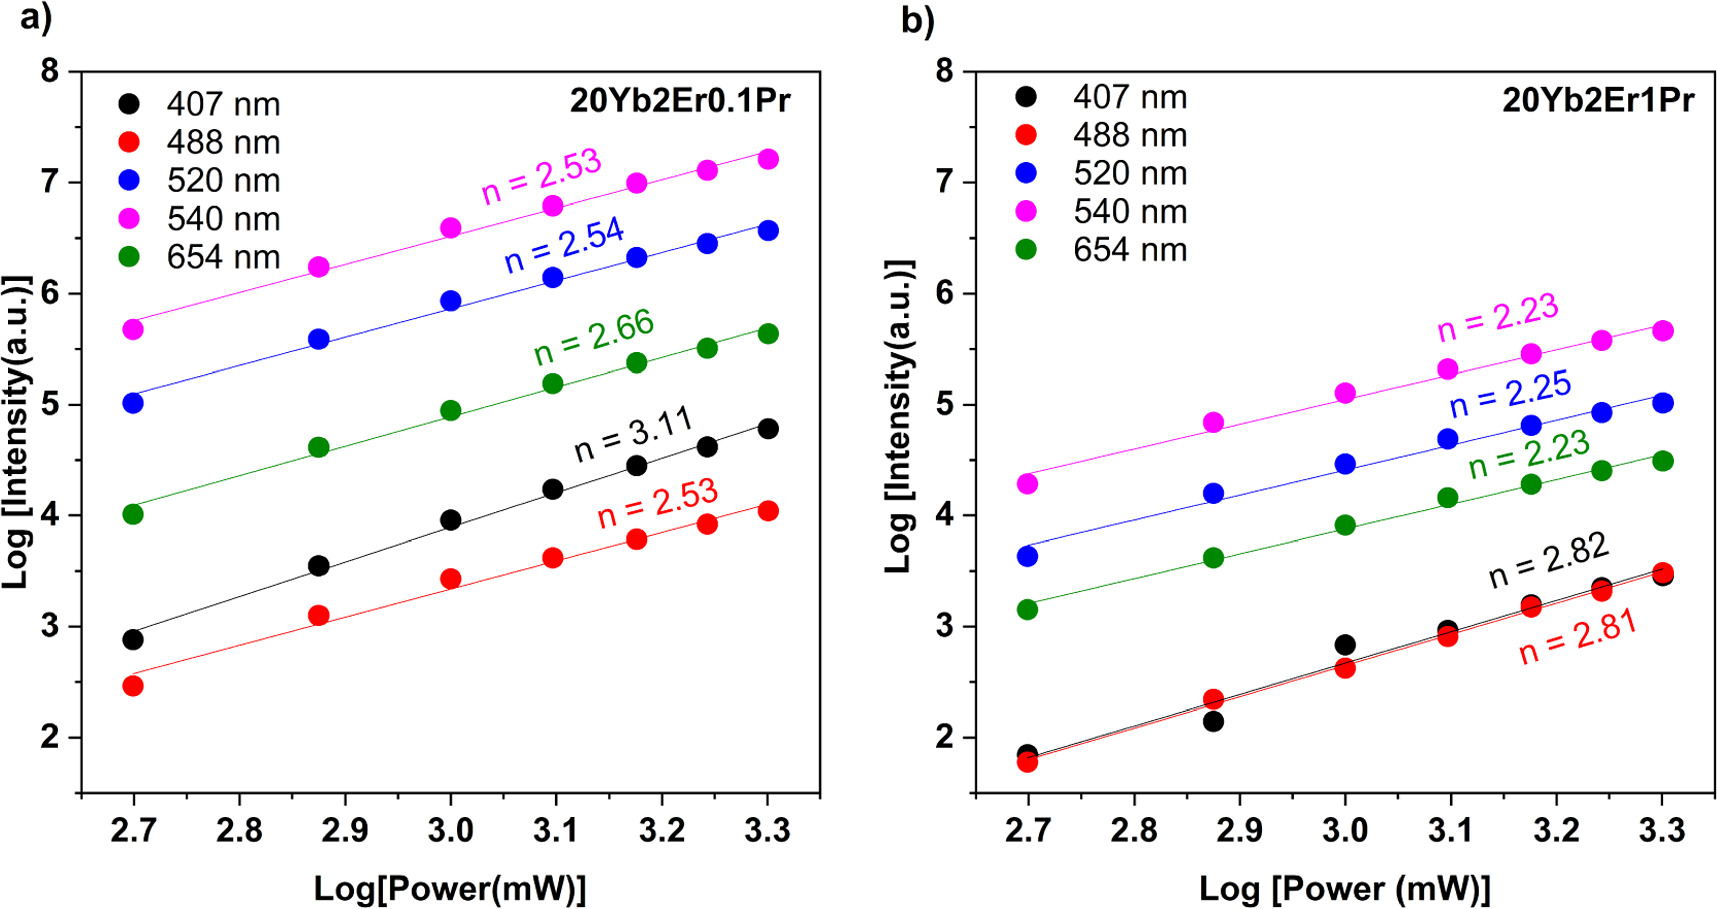
Figure 6. The logarithmic plot of emissions versus excitation power dependence of co-doped NaYF4 in different Pr3+ ion concentration for (a) 20Yb2Er0.1Pr, and (b) 20Yb2Er1Pr.
Download figure:
Standard image High-resolution image
Figure 7. Near-infrared photoluminescence spectra of UCNPs under different excitation power of 980 nm diode laser (a), (c) and accompanied by Logarithmic plot (b), (d). The slope value comparison versus excitation power at 1290 and 1530 nm emission for samples (e).
Download figure:
Standard image High-resolution imageIn the visible region, nanoparticles under a 980 nm laser diode indicated that the number of photons involved in the upconversion process was found to be closely related to the concentration of dopant ion, as the increment in concentration can either promote or impede the upconversion process. This relationship is illustrated in figures 6(a) and (b), which shows the impact of increasing the Pr3+ concentration from 0.1% to 1%, respectively.
Figure 6(a) shows that for the 20Yb2Er0.1Pr sample, the slope values for UC emission peaks at 407, 488, 520, 540, and 654 nm were 3.11, 2.53, 2.54, 2.53, and 2.66, respectively. Since the slope values are approximately three, the upconversion mechanism should be a three-photon process. Subsequently, upon adding 1 mol% of Pr3+ ions, the slope values decreased to 2.82, 2.81, 2.25, 2.23, and 2.23 for the 407, 488, 520, 540, and 654 nm emissions, respectively, as demonstrated in figure 6(b). The slope value for 407 and 488 nm emission is close to 3, indicating that three-photon processes are involved in populating the 2H9/2 and 4F7/2 levels. For the 520, 540, and 654 nm emissions, the slope values are close to 2, indicating two-photon processes are involved in populating the 2H11/2, 4S3/2, and 4F9/2, respectively. The decrease in slope values for 520, 540, and 654 nm emissions from three to two photons can be attributed to the transitions 4F7/2→3P0 and the following multiphonon relaxations (MPRs) and cross-relaxation (CR) processes. Additionally, competition between the energy transfer from 4I13/2 (Er3+) to 3F3,4 (Pr3+) level and upconversion processes pumping to 4F7/2 where the depletion of intermediate excited states of 4I13/2 level might be effective [32].
In the NIR region, 0.1% and 1% Pr3+ doped NaYF4: Yb, Er samples were examined for 1290 nm and 1530 nm emissions at different pump powers of the 980 nm diode laser and the pump power-dependent upconversion luminescence spectra is recorded as shown in figures 7(a), (c). The log–log plots for 1290 nm and 1530 nm emissions, logarithmic upconversion emission intensity versus logarithmic excitation power density graphs, are illustrated in figures 7(b), (d). For the 1290 nm emissions, the slope value of the 20Yb2Er0.1Pr sample was found to be 0.58, as shown in figure 7(a). As Pr3+ ion concentrations increased in the system, the slope value of the 20Yb2Er1Pr sample decreased to ∼0.08, as depicted in figure 7(d). These results suggest that both slope values correspond to the single photon process for populating the 1G4 level. The evidence for 1530 nm emission from the log–log plot exhibits the slope value of 1.30 and 0.24 for the 20Yb2Er0.1Pr and 20Yb2Er1Pr samples, respectively. The decrease in slope values observed as Pr3+ ion concentration increases, shown in figures 7(b), (d). The variation in slope value for 1290 nm and 1530 nm depending on Pr3+ concentration is given in figure 7(e). The rate of decreasing slope value at 1530 nm is greater than 1290 nm, indicating a faster depletion for the 4I13/2 level compared to the 4I11/2 level. Consequently, the energy transfer rate of 4I13/2→3F3,4 is faster than 4I11/2→1G4.
3.3.4. Fluorescence decay time
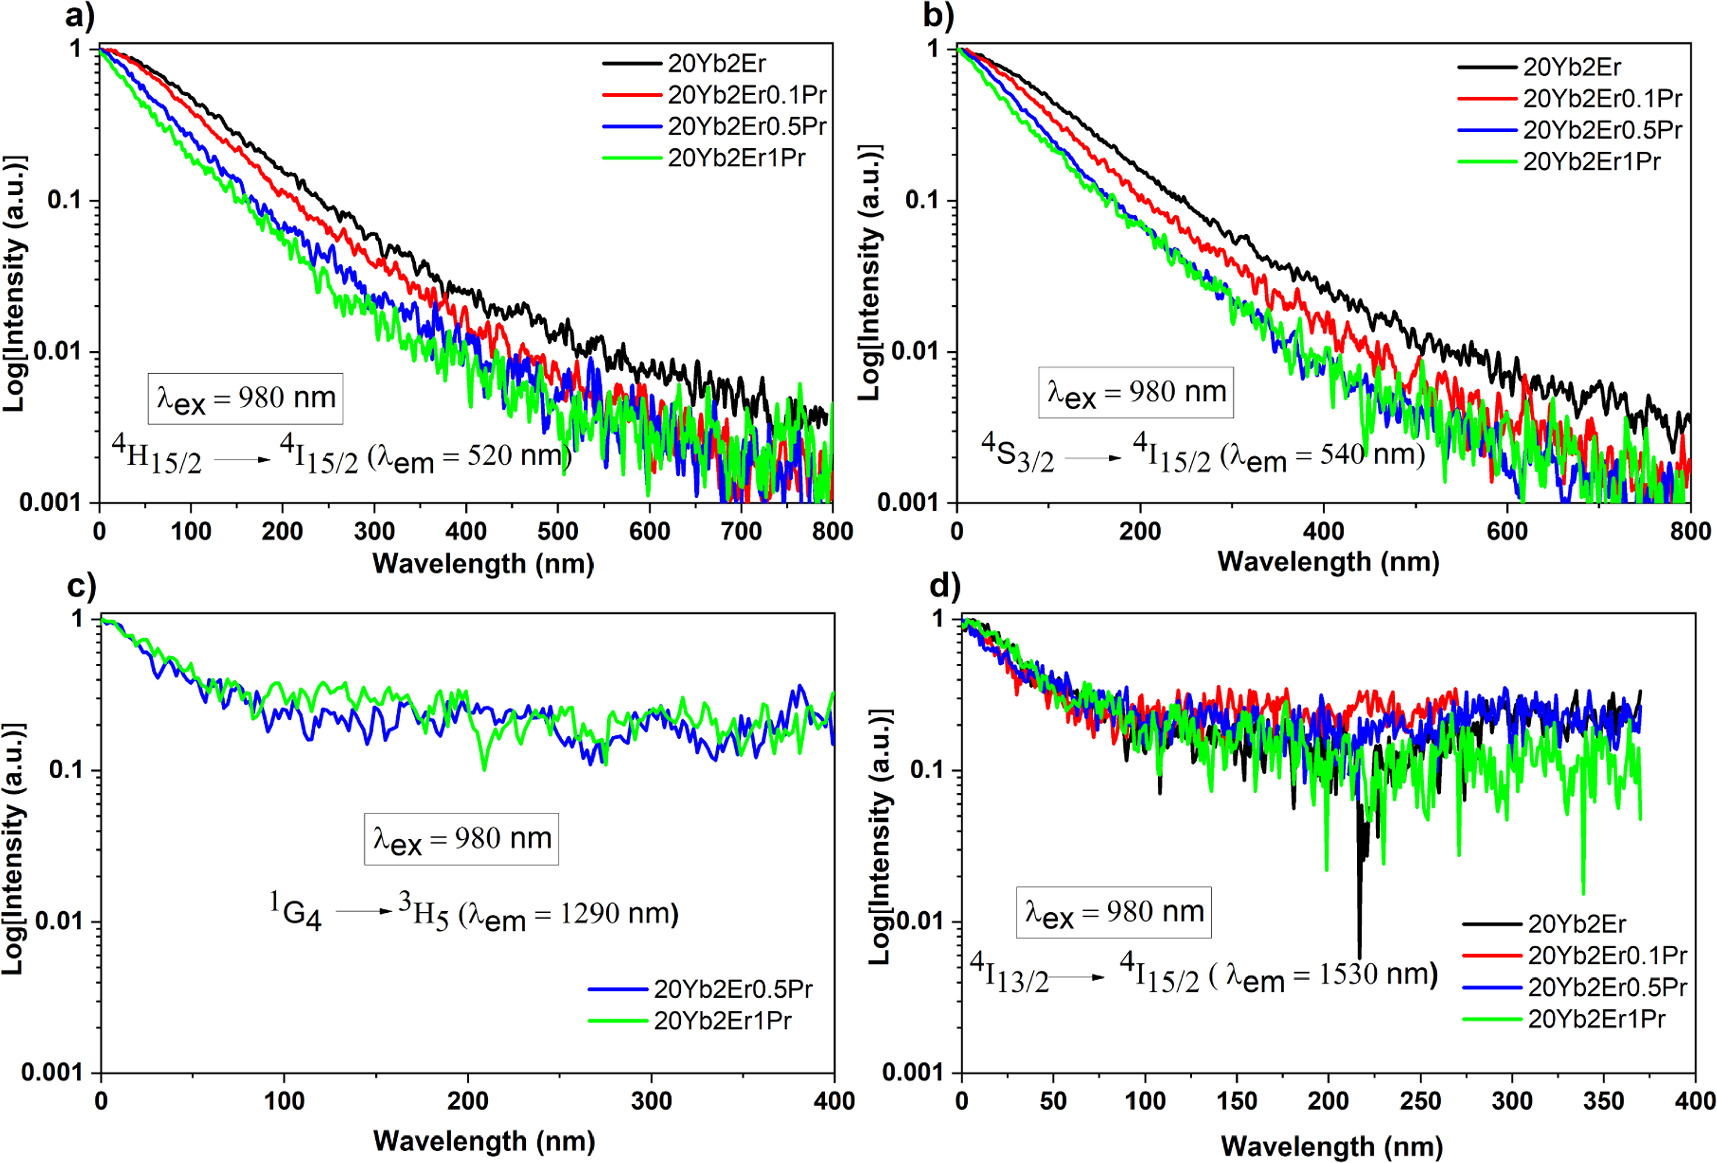
Decay time analysis was conducted on the samples to achieve a better understanding of the energy transfer and upconversion mechanism. Samples with increased concentration of Pr3+ dopant were examined under 980 nm pulsed laser excitation. To demonstrate the concentration-dependent photoluminescence dynamics of the Pr3+ dopant, decay time analysis was monitored at 520 nm (figure 8(a)), 540 nm (figure 8(b)), 1290 nm (figure 8(c)), and 1530 nm (figure 8(d)). The emission lifetimes (τ) were calculated using a single exponential decay function (equation (3)) and results presented in table 3.

where I(t) represent the photoluminescence intensity at a specific time point corresponding to the on and off of the pulsed laser. τ is the decay lifetime of the upconversion luminescence.

Figure 8. The decay curves of emission peaks at (a) 520 nm (b) 540 nm (c) 1290 nm (d) 1530 nm in Yb3+, Er3+, Pr3+ co-doped NaYF4 solid solution.
Download figure:
Standard image High-resolution imageTable 3. Lifetime measurements of samples at different emission peaks.
| Samples | 20Y2Er | 20Y2Er0.1Pr | 20Y2Er0.5Pr | 20Y2Er1Pr |
|---|---|---|---|---|
| Lifetime 520 nm | 111.98 ± 0.77 μs | 92.61 ± 0.50 μs | 72.65 ± 0.24 μs | 62.55 ± 0.20 μs |
| Lifetime 540 nm | 111.53 ± 0.65 μs | 90.96 ± 0.47 μs | 72.42 ± 0.23 μs | 66.73± 0.20 μs |
| Lifetime 1290 nm | — | — | 32.63 ± 1.41 μs | 40.52 ± 2.22 μs |
| Lifetime 1530 nm | 34.89 ± 1.02 μs | 19.83 ± 0.90 μs | 31.93 ± 1.24 μs | 38.04 ± 1.15 μs |
The decay time at 520 nm for the sample without Pr3+ ions was calculated to be 111.98 μs, which originated from the 2H11/2 energy level of the Er3+ ion. As the Pr3+ concentration was increased to 0.1% in the second sample, decay time decreased to 92.61 μs. With further increases in the Pr3+ concentration to 0.5% and 1%, decay times decreased to 72.42 μs and 62.55 μs, respectively. The decay time at 540 nm presents similar behavior with increasing Pr3+concentration, as shown in table 3. It is expected that the decrease in the lifetime of 2H11/2 and 4S3/2 levels might be caused by an energy transfer of Er3+:4F7/2→ Pr3+: 3P0.
In the NIR region, decay time was studied as well. The decay time for the samples without Pr3+ and with 0.1% Pr3+ was not detected at 1290 nm. By increasing the Pr3+ concentration to 0.5% Pr3+ and 1% Pr3+, the decay time is determined to be 32.63 μs and 40.52 μs, respectively.
This increment in decay times at 1290 nm for the samples with varying Pr3+ concentrations demonstrates the existence of energy transfer (4I11/2→1G4). On the other hand, the decay time at 1530 nm (4I13/2→4I15/2) for all samples demonstrated an irregular behavior as Pr3+ concentration increased (table 3). Hence, there should be another mechanism explaining this irregularity in lifetime at 1530 nm.
Based on these findings, the energy transfer from Er3+ to Pr3+ can be estimated. As deduced from decay time and power-dependent analysis, it is possible to figure out the upconversion mechanism, as shown in Scheme
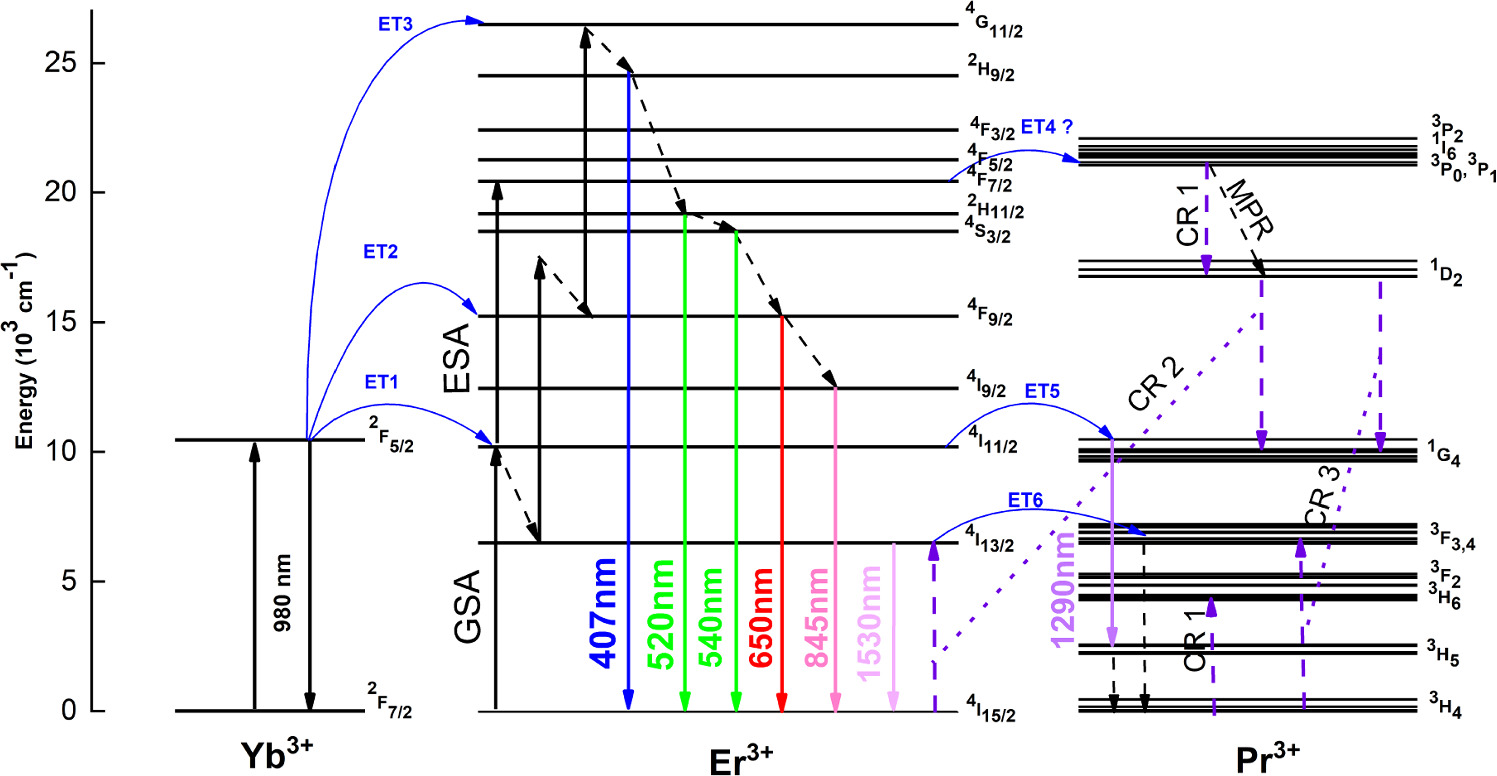
Scheme 1. Energy level diagram of the upconversion mechanism of a NaYF4: Yb3+, Er3+, and Pr3+ dopant ion system under 980 nm laser excitation.
Download figure:
Standard image High-resolution image
The energy level diagram, Scheme
Later on, both cross relaxations and ET5 (Er3+:4I11/2 →Pr3+:1G4) populate the 1G4 level, and weak emission is generated at 1290 nm as a result of 1G4→3H5 transitions. In the CR2 process, Pr3+ ions relax from the 1D2 to 1G4 level and promote the 4I13/2 (Er3+) level resulting in 1530 nm emission. The near-resonant ET6 from Er3+: 4I13/2 →Pr3+:3F3, causes the quenching of 1530 nm emission through the MPR process [34].
Herein, the quenching in blue (407 nm), green (520 and 540 nm), red (654 nm) and near-infrared (845 nm) emissions can be attributed to the decrease in the 4I13/2 population. The decrease in the 4I13/2 population leads to the decrease in the 4F9/2 population through ET2 and subsequently followed by the decrease in the 4G11/2 population through ET3. Two mechanisms affect the population of the 4I13/2 level. One of the mechanisms is the CR2 process that is highly affected by the particle size and Pr3+ concentration. The other mechanism is the ET6 energy transfer process affected by only Pr3+ concentration. The probability of the CR2 relaxations in smaller particles is quite high due to the random distribution of rare earth ions. While the probability of CR2 relaxation is quite less in the larger particles due to the strict distribution of rare earth ions [35]. To better understand the CR2 mechanism, populating 4I13/2, we have analyzed the intensity ratio of R/G, as shown in table 4.
Table 4. The decay time and R/G ratio analysis of samples associated with Pr3+ concentration and particle size.
| Samples | R/G ratio | Lifetime 1530 nm | Pr3+ concentration | Particle Size (nm) TEM analysis |
|---|---|---|---|---|
| 20Yb2Er | 0.407 | 34.89 ± 1.02 μs | 0% | 23.66 |
| 20Yb2Er0.1Pr | 0.102 | 19.83 ± 0.90 μs | 0.1% | 31.08 |
| 20Yb2Er0.5Pr | 0.144 | 31.93 ± 1.24 μs | 0.5% | 21.18 |
| 20Yb2Er1Pr | 0.188 | 38.04 ± 1.15 μs | 1% | 22.48 |
Comparing 20Yb2Er (23.66 nm) and 20Yb2Er0.1Pr (31.08 nm), as particle size increases R/G ratio decreases from 0.407 to 0.102, indicating the decrease in CR2 relaxations depopulating the 4I13/2 level. Pr3+ concentration is another effect that populates 4I13/2 level through the CR2 process. However, the CR2 processes that are populating 4I13/2 level are negligible for small concentrations (0.1 mol % Pr3+ doped sample) [36]. Notably, the cross relaxations stemming from Er3+ ions are ignored as the Er3+ concentration is constant for all samples. The ET6 process mitigating emission intensity due to non-radiative decays is negligible for the 0.1 mol % Pr doped sample as well. Overall, the less likely CR2 relaxation process results in a depopulation of the 4I13/2 level, giving rise to a shorter decay time from 34.89 μs to 19.83 μs.
By increasing the Pr3+ concentration to 0.5 mol% (sample 20Yb2Er0.5Pr), both decrease in particle size to 21.18 nm and increase in Pr3+ concentration are effective on the increase in CR2 relaxations populating 4I13/2 level. Although the rise in ET6 process in parallel with the Pr3+ concentration depopulates 4I13/2 level. Yet, the CR2 processes populating 4I13/2 levels are dominant leading to an increase in intensity ratio of R/G to 0.144. Hence, a longer decay time was observed from 19.83 μs to 31.93 μs.
Further increasing Pr3+ concentration to 1 mol% (sample 20Yb2Er1Pr), particle size increased to 22.48 nm leading to a decrease in CR2 relaxations but their contribution is negligible as particle sizes are almost equal. The increase in Pr3+ concentration causes an increase in CR2 relaxations, which populate the 4I13/2 level. However, due to the decrease in the distance between the lanthanide ions, ET6 processes increase and, as a result, 4I13/2 is depopulated. The population of 4I13/2 with CR2 process is estimated to be dominant over the depopulation of 4I13/2 with ET6 process, causing a further increase in the intensity ratio of R/G to 0.18 and, Hence, a longer decay time observed from 31.93 μs to 38.04 μs.
Meanwhile, an energy transfer ET5 may occur from Er3+ (4I11/2) to Pr3+ (1G4) level due to their well-alignment. This transfer leads to a weak emission at 1290 nm, corresponding to the transitions of 1G4→3H5. The observed emission at 1290 nm seems to be affected by CR2 relaxations enhancing the population of 1G4 level as well. As stated before, particle size and Pr3+ concentrations are the factore that highly affect the CR2 relaxation process [35, 36]. Herein, it is estimated that within the CR2 process, particle size is more effective than Pr concentration. Even if Pr3+ concentration is a significant factor in the population of 1G4 level through CR2, the gradual increment in 1290 nm would be anticipated in parallel with Pr3+ concentration. Nevertheless, the results show that the enhancement of 1G4→3H5 transitions is more associated with particle size rather than Pr3+ concentrations.
4. Conclusion
In conclusion, nanoparticles with an average size of around 22 nm were synthesized using thermal decomposition technique. XRD and TEM characterization techniques were utilized to characterize the morphology and crystal structure of the nanoparticles. The luminescence properties of UCNPs were examined by co-doping various amounts of Pr3+ in NaYF4: Yb3+, Er3+ to understand the upconversion luminescence properties. The luminescence intensity of Er3+ including blue (407 nm), green (520 and 540 nm), red (654 nm), and near-infrared (845 nm and 1530 nm) emissions was significantly quenched and Pr3+ emission intensity at 1290 nm (Pr3+:1G4→3H5) changes irregularly upon doping with Pr3+ ions. Power-dependent analysis revealed a gradual decrease in the intensity in the visible region. The slope value decreased from three to two, which can be attributed to the competition between the energy transfer from 4I13/2 (Er3+) to 3F3,4 (Pr3+) level and upconversion processes for the depletion of intermediate excited states of 4I13/2 level. A similar trend was observed in the near-infrared region as well. The rate of decreasing slope value at 1530 nm is greater than 1290 nm, indicating a faster depletion for the 4I13/2 level compared to the 4I11/2 level. Consequently, the energy transfer rate of 4I13/2→3F3,4 is faster than 4I11/2→1G4. The decay time measurements at the 4I13/2 level of Er3+ ions change irregularly with the Pr3+ concentrations due to the competition between CR2 and ET6 energy transfer processes. From the results, it is estimated that particle size is more effective than Pr3+concentration in the population of 4I13/2 through the CR2 process. Simultaneously, the population of 1G4 level enhanced with the CR2 process as well. Therefore emission at 1290 nm (Pr3+:1G4→3H5) is also more affected by the particle size than Pr3+concentration. The results presented in this work serve as valuable literature for researchers interested in this field, providing a foundation for further investigations and advancements in the utilization of Pr3+ ions in upconversion applications.
Acknowledgments
This work was supported by the TUBITAK under Project no. 20AG011. We would like to thank Prof. Murat Erdem for the invaluable support in PL analysis and Pınar Akkuş Süt for TEM observations.
Data availability statement
No new data were created or analysed in this study.
Declaration of competing interest
The authors declare that they have no known competing financial interests or personal relationships that could have appeared to influence the work reported in this paper.