
Abstract
In this study, QuEChERS extraction was combined with dispersive liquid–liquid microextraction (DLLME) to extract pesticides from tropical fruits for determination by a highly accurate and sensitive liquid chromatography-quadrupole time-of-flight mass spectrometry (LC-QTOF-MS/MS) system. The QuEChERS method served as a matrix clean-up tool and the DLLME method preconcentrated the analytes for their determination at trace levels. All parameter variables of the DLLME method were optimized to improve the extraction output and lower the limits of detection and quantification (LOD and LOQ) for all the analytes. Under the optimum experimental conditions, the LOD and LOQ values were found in the range of 0.004–0.013 and 0.27–0.61 μg l−1, respectively. The detection limits achieved by direct LC-QTOF-MS/MS analysis were increased by about 10–260 folds using the optimized DLLME method. To assess the accuracy and applicability of the developed method, spike recovery experiments on tropical fruits were carried out. The matrix matching calibration method was used to enhance the quantification accuracy of the analytes in kiwi, pineapple, and mango matrices, with percent recoveries ranging between 89 and 117%.
Export citation and abstract BibTeX RIS

Original content from this work may be used under the terms of the Creative Commons Attribution 4.0 licence. Any further distribution of this work must maintain attribution to the author(s) and the title of the work, journal citation and DOI.
1. Introduction
Pesticides are toxic compounds or a combination of toxic compounds that are used to prevent, deter, control, or kill insects, weeds, rodents, fungus, or other harmful organisms [1]. Pesticides are used globally to enhance food production, improve human health, and lower the rate of illness [2]. The most important advantages of the use of pesticides are the prevention of diseases through pest control and the high yield of agricultural products. However, humans can be exposed to pesticide residues by consuming contaminated foods [3]. The World Health Organization estimates that each year in developing countries, about 3,000,000 pesticide poisonings and 220,000 fatalities occur [4]. Pesticides can enter the body through the mouth (oral ingestion), nose (inhalation), or skin (dermal contact) [5]. Thus, it is very important to monitor the occurrence of pesticides in various matrices including biological, environmental, and food samples. Since pesticide residues occur at trace levels, sensitive analytical instruments are required for their accurate and precise determinations. The matrices of fruits are complex and contain a lot of vitamins, minerals, carbs, and proteins. In order to avoid co-extraction of matrix components, special sample preparation procedures are needed to obtain clean samples for instrumental determination [6].
Regulatory authorities in different countries have set maximum residue limits for different food products to ensure the safety of their citizens. The European Food Safety Authority (EFSA) and the Food and Agriculture Organization (FAO) have been evaluating maximum pesticide residue levels for food safety since 1962 and 1976, respectively [7]. Pesticide residue limits regulated by the Ministry of Agriculture and Forestry in Turkey are regularly updated in line with the European Union (EU) harmonization procedures. The European Union has set a multi-residue limit (MRL) of 0.01 mg kg−1 for pesticides that are frequently used in agricultural products [8].
Prior to determination, the analytes must be separated from complex matrices by performing appropriate extraction, cleanup, and/or preconcentration procedures. The two basic sample preparation methods are liquid–liquid extraction (LLE) and solid-phase extraction (SPE).
The LLE is one of the first enrichment and matrix isolation techniques used in analytical chemistry, but it is associated with drawbacks such as long processing periods and requires a lot of organic solvent [9]. The SPE is a relatively expensive extraction method, although much less solvent is utilized when compared to LLE [10, 11]. In recent times, these two classical methods have been displaced by microextraction methods due to benefits including minimal organic solvent usage, high enrichment factor, and less sample preparation steps [12, 13]. Rezaee et al introduced dispersive liquid–liquid microextraction (DLLME) in 2006 as a quick and cheap microextraction process that offers high analyte recovery and enrichment factor. With the DLLME method, excellent results were recorded in the determination of polycyclic aromatic hydrocarbons in water samples [11].
Instrumental determination of pesticides that are thermally stable, volatile and have low-polarity are often carried out using electron capture detection (ECD), mass spectrometry (MS), and tandem mass spectrometry (MS/MS), coupled with gas chromatography (GC) for separation of analytes [14–17]. For pesticides that have high polarity, low volatility, and are thermally unstable, liquid chromatography (LC) methods with MS detection are used for their determination. The ability of LC-MS systems to separate and quantify non-volatile analytes with large molecular masses and wide alkalinity range distinguishes them from GC-MS systems [18]. Although the LC-MS system is frequently used to determine pesticide concentrations in fruits and vegetables, MS/MS and triple quadrupole (QqQ) mass spectrometers have become more suitable for this purpose because of their excellent sensitivity and selectivity [19–21]. Using the two-stage MS/MS operating mode, analysis of secondary fragmentation products allows for better qualification of compounds with similar molecular weights. This makes it possible to determine pesticides at trace levels even when there are several interfering compounds [21].
Although fragmentation products are crucial for the identification of pesticides, accurate and precise quantification can be hindered by the complexity of sample matrices. Therefore, a proper extraction process that ensures matrix clean-up and analyte enrichment must be employed. The Quick, Easy, Cheap, Effective, Robust, and Safe (QuEChERS) sample clean-up and analyte extraction method was developed by Anastassiades et al in 2003. It is based on dispersive solid phase extraction and uses certain sorbents for the cleanup process, where impurities are removed from the matrix. [22]. The QuEChERS approach can be used for a wide variety of analytes, such as polar, semi-polar, and non-polar pesticide contaminants in different food matrices [23]. Although the QuEChERS method is frequently used for routine quality control of complicated samples and has the benefits of its acronym, it has some drawbacks and a typical example is no analyte enrichment [24]. Therefore, the aim of this study was to use the high enrichment factor of the DLLME method to augment the effective matrix clean-up of the QuEChERS method to facilitate the determination of pesticides in tropical fruit samples by LC-QTOF-MS/MS.
2. Materials and methods
2.1. Chemicals
All chemicals used in the experiments were of analytical grade and HPLC grade solvents were used for the LC system. A Milli-Q® Reference Water Purification System was used to supply ultrapure deionized water for the study. Ammonium formate (HCO2NH4) was dissolved in water to prepare a buffer solution, which was regulated to pH 3.0 using dilute formic acid (CH2O2). The pesticide standards with percent purities greater than 98% and the internal standard phenytoin were purchased from Dr Ehrenstorfer (Augsburg—Germany) and Sigma-Aldrich, (Darmstadt—Germany), respectively. Other chemicals used in the method development were chloroform, 1,2-dichloroethane, dichloromethane, ethyl acetate, ethanol (EtOH), isopropyl alcohol (IPA), methanol (MeOH), acetonitrile (ACN), potassium chloride, sodium sulfate and sodium carbonate, all purchased from Merck (Darmstadt—Germany). The pesticide standards and the internal standard were dissolved in appropriate solvents to prepare separate stock standard solutions (≈1000 mg l−1) and stored at −20 °C. Working standard solutions were prepared daily by diluting aliquots of the stock standard solutions. The pH of the buffer solution was measured with a Mettler Toledo brand pH meter.
2.2. Instrumental conditions and method development
An Agilent 1260 HPLC (High Performance Liquid Chromatography, Agilent Technologies, USA) system with an autosampler, binary pump, and degasser was employed in this study. System parameters of the instrument were optimized to enhance the signals of the analytes for effective qualitative and quantitative determinations. The target analytes were eluted through Eclipse plus C18 RHD (2.1 × 50 mm, 1.8 μm) and Agilent Poroshell 120 EC-C18 (3.0 × 150 mm, 2.7 μm) analytical columns for separation. In order to obtain optimum separation and peak shapes, different mobile phase compositions were tested. The compounds were well separated using a gradient program that consisted of 25 mM ammonium formate buffer at pH 3.0 - acetonitrile (9:1, v/v) as mobile phase A and 25 mM ammonium formate buffer - acetonitrile (1:9, v/v) as mobile phase B. Column temperature, mobile phase flow rate, and injection volume were all adjusted to 30 °C, 0.40 ml min−1, and 20 μl, respectively. The total run time for the separation of the eight pesticides was 15 min. The gradient program was started at 5.0% solvent B and held for 1.0 min, increased to 55% B in 1.0 min and held for 5.0 min, increased to 95% B in 0.1 min and held for 1.4 min and then back to 5.0% solvent B in 0.1 min, where it was held until the end of the gradient. The eluted pesticides were detected by an Agilent 6530 model quadrupole-time-of-flight mass spectrometer (LC-QTOF-MS/MS) system with electrospray ionization (ESI). The electrospray ionization source's settings were as follows; source temperature: 300 °C, drying gas flow rate: 12 l min−1, fragment voltages: 175 V, and capillary voltage: 4.5 Kv.
The analytes were detected using the optimum conditions of the MS/MS and ESI source in the positive ion mode. Nitrogen was used as both nebulizer and collision gas, where the nebulizer's pressure was 50 psi. To eliminate variations caused by instrumental fluctuations, phenytoin was utilized as an internal standard at a concentration of 1.0 mg l−1. Extracted ion chromatograms (EIC) of the analytes are presented in figure 1. The most prominent transition ion was chosen as the quantifier ion and the second most prominent one as the qualifier ion for confirmatory evaluation. Parameters of the analytical instrument that were used to qualify and quantify the analytes are summarized in table 1. The obtained data was processed using Agilent MassHunter 7.0 Qualitative Analysis, MassHunter 10.0 Quantitative Target Analysis, and Pesticide PCDL, B.07.01 library Manager softwares.
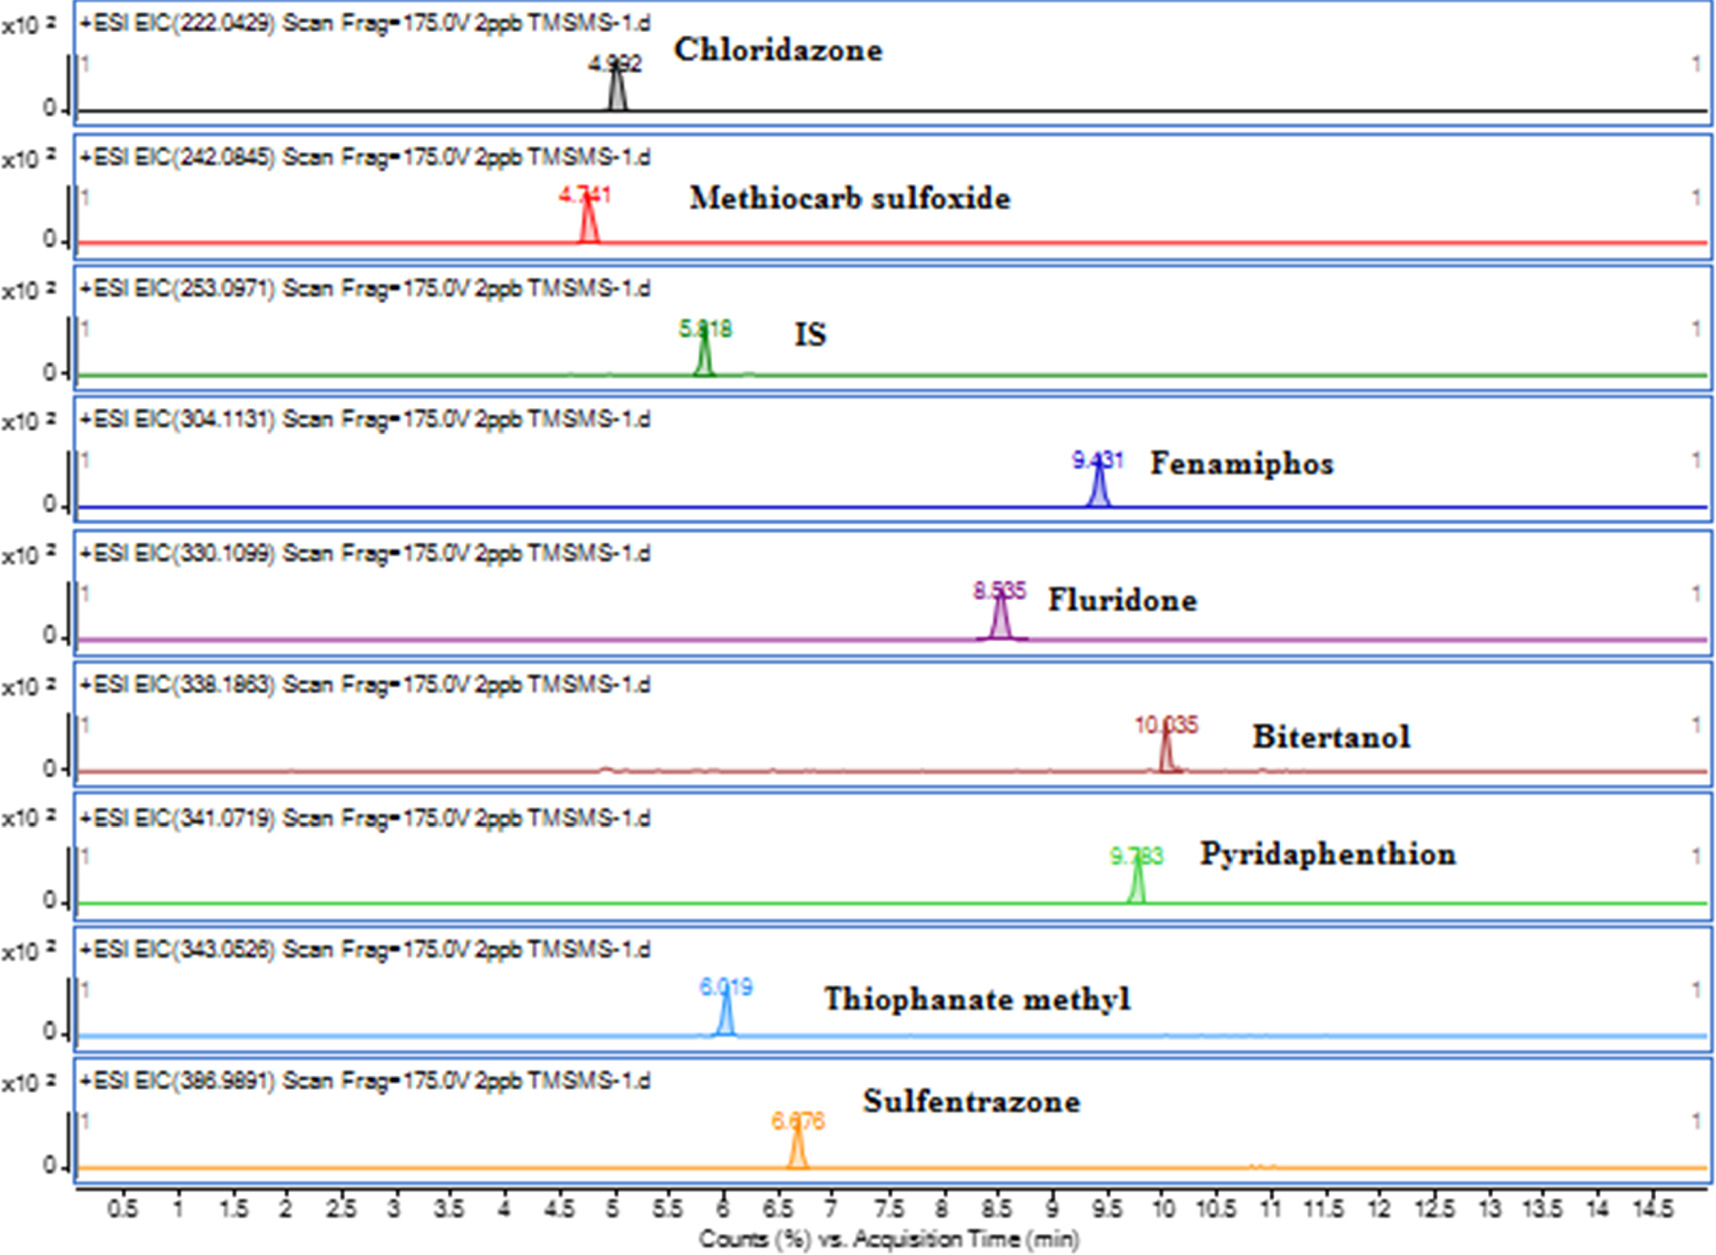
Figure 1. Extracted ion chromatograms (EIC) of the eight pesticides recorded for a 2.0 μg/L mixed standard solution.
Download figure:
Standard image High-resolution imageTable 1. Collision energies, retention times, precursor, quantifier and qualifier ions used for pesticides determined with the LC-QTOF-MS/MS system.
| Analyte | Precursor ion (m/z) | Quantifier ion (m/z) | Qualifier ion (m/z) | Collision E. (V) | Retention Time (min) |
|---|---|---|---|---|---|
| Chloridazon | 222.0429 | 77.0385 | 65.0387 | 40 | 4.967 |
| Methiocarb sulfoxide | 242.0845 | 185.0631 | 107.0491 | 10 | 4.699 |
| Fenamiphos | 304.1131 | 217.0083 | 104.0491 | 25 | 9.306 |
| Fluridone | 330.1099 | 310.1037 | 309,0959 | 35 | 8.409 |
| Bitertanol | 338.1863 | 70.0399 | 99.0844 | 15 | 9.976 |
| Pyridaphenthion | 341.0719 | 189.0589 | 205.0430 | 15 | 9.708 |
| Thiophanate methyl | 343.0526 | 151.0324 | 192.0762 | 20 | 5.910 |
| Sulfentrazone | 386.9891 | 306.9943 | 129.0546 | 20 | 6.567 |
| Phenytoin (IS) | 253.0971 | 104.0495 | 182.0964 | 40 | 5.743 |
2.3. QuEChERS method
The QuEChERS technique is well-known for being a reliable, safe, simple, inexpensive, and efficient tool for preparing different sample matrices for pesticide residue analysis. In this study, the samples' extraction and cleaning procedures were carried out in accordance with the AOAC Official Method 2007.01 [25]. Here, 15 g of homogenized samples were weighed into 50 ml falcon tubes before adding 15 ml of acetonitrile acidified with 1.0% acetic acid.
The tube was strongly shaken for 60 s after adding 6.0 g of anhydrous magnesium sulphate (MgSO4) and 1.50 g sodium acetate (C2H3NaO2), and then centrifuged at 4500 rpm for 5.0 min. A 15 ml tube containing 1200 mg MgSO4 and 400 mg primary secondary amine (PSA) was then filled with 8.0 ml of the acetonitrile supernatant and shaken for 60 s before centrifuging at 6000 rpm for 4 min. In order to apply the optimum DLLME method to the QuEChERS extract, 5.0 ml of the acetonitrile extract from the second QuEChERS step was transferred into a 100 ml volumetric flask and diluted to the mark with ultrapure water.
2.4. DLLME procedure
The extraction solvent (200 μl chloroform) and disperser solvent (2.0 ml acetonitrile) were premixed and injected into 10 ml of the standard/sample solution using a 5.0 ml syringe. The resulting cloudy solution was vortexed for 15 s to further boost the interaction of the extractant with the analytes for high extraction output.
The sample tube was placed in a centrifuge device and centrifuged for 2.0 min at 6000 rpm to allow rapid separation of the extractant from the aqueous solution. A sufficient volume (≈100 μl) was then taken from the settled organic phase into glass insert vials for automated injection into the LC-QTOF-MS/MS system.
3. Results and discussion
In order to increase the extraction yield of the analytes, experiments were carried out to select optimum values of the parameters that had major effect on the microextraction method. The DLLME method depends on extraction solvent and disperser solvent types and their volumes. Thus, these parameters were optimized in addition to the effect of salt addition. During the extraction process, one parameter was tested at different variables, while the other parameters were kept constant at one variable. For the LC-QTOF-MS/MS system, optimization was performed using a 10 μg l−1 mixed standard solution of the analytes. Analytical figures of merit were determined for direct measurement of the analytes with the LC-QTOF-MS/MS system. All optimization parameters were assessed in triplicates, from which the highest average peak area was selected as optimum parameter value and percent relative standard deviation was used to evaluate the method's repeatability.
3.1. Extraction solvent type and amount
A suitable extraction solvent should not be miscible with water but miscible with the dispersive solvent. The extraction solvent should be preferably denser than water in order for it to settle below water and avert volatility losses that occur for low density solvents [26]. Chlorinated solvents, such as tetrachloroethylene, chloroform, or chlorobenzene, among others, are utilized in typical applications [27]. In this optimization step of the study, chloroform, 1,2-dichloroethane, and dichloromethane were tested as extraction solvents; wherein 200 μl of each solvent was dispersed with 2.0 ml of methanol. Chloroform was selected as the optimum extraction solvent for producing the highest average peak area value for the majority of the analytes as displayed in figure 2.

Figure 2. A plot of extraction solvent types versus peak area, n = 3 for error bars (10 μg l−1 aqueous standard, 200 μl extraction solvent and 2.0 ml methanol).
Download figure:
Standard image High-resolution imageHigh enrichment factor (EF) is an indication of an effective DLLME process. The volume of an extraction solvent is a very critical parameter because it directly impacts the enrichment factor of a method. For a fixed amount of sample volume, the enrichment factor increases with decreasing extraction solvent volume but beyond a critical volume, it will not be sufficient for complete recovery of the analytes in solution. Thus, different volumes of chloroform (200, 300, 400, and 500 μl) were tested to determine the optimum volume for both analyte recovery and preconcentration. Though tested, there was no phase observed for 150 μl of chloroform due to high miscibility in the aqueous solution. As shown in figure 3, a general decreasing trend in peak area values occurred with increasing extraction solvent volume, which can be attributed to analyte dilution by the excess volumes of chloroform. Samples extracted with 500 μl of extraction solvent contributed to dilution and decreased peak area values.

Figure 3. A plot of extraction solvent volumes versus peak area, n = 3 for error bars (10 μg l−1 aqueous standard solution and 2.0 ml methanol).
Download figure:
Standard image High-resolution imageThe highest peak area values were clearly recorded for 200 μl, and it was selected as optimum value for the subsequent experiments.
3.2. Disperser solvent selection and amount
In order to maximize the surface area of the extraction solvent in solution and its interaction with the analytes in the DLLME method, it is essential to choose a proper disperser solvent. A disperser solvent should be miscible with both extraction solvent and water [28] in order to satisfy the three solvent system consisting of the extraction solvent, disperser solvent and aqueous sample containing the analytes of interest [28–30]. Ideal disperser solvents fall in the mid-range of the polarity scale, which allows them to be miscible with both water and other organic solvents.
Here, 2.0 ml of commonly used organic solvents (methanol, ethanol, isopropyl alcohol and acetonitrile) were tested to evaluate their dispersive capacities for the extraction solvent. Acetonitrile recorded a very high dispersive effect for all eight analytes as shown in figure 4, corresponding to the highest peak areas values. After selecting ACN as the optimum disperser solvent, different volumes (1.0, 2.0, 3.0, and 4.0 ml) were tested to determine the optimum volume for the extraction solvent. After the centrifugation process, it was realized that no phase was formed for the extraction solvent dispersed with 4.0 ml of acetonitrile. It can be deduced that the 4.0 ml volume significantly altered the polarity of the aqueous solution to allow complete miscibility with the extraction solvent. A very low volume was observed for the 3.0 ml volume but it was sufficient to be collected for instrumental measurement. The 2.0 ml volume was chosen as the optimum one for further experiments because it was slightly higher than the other volumes as presented in figure 5.
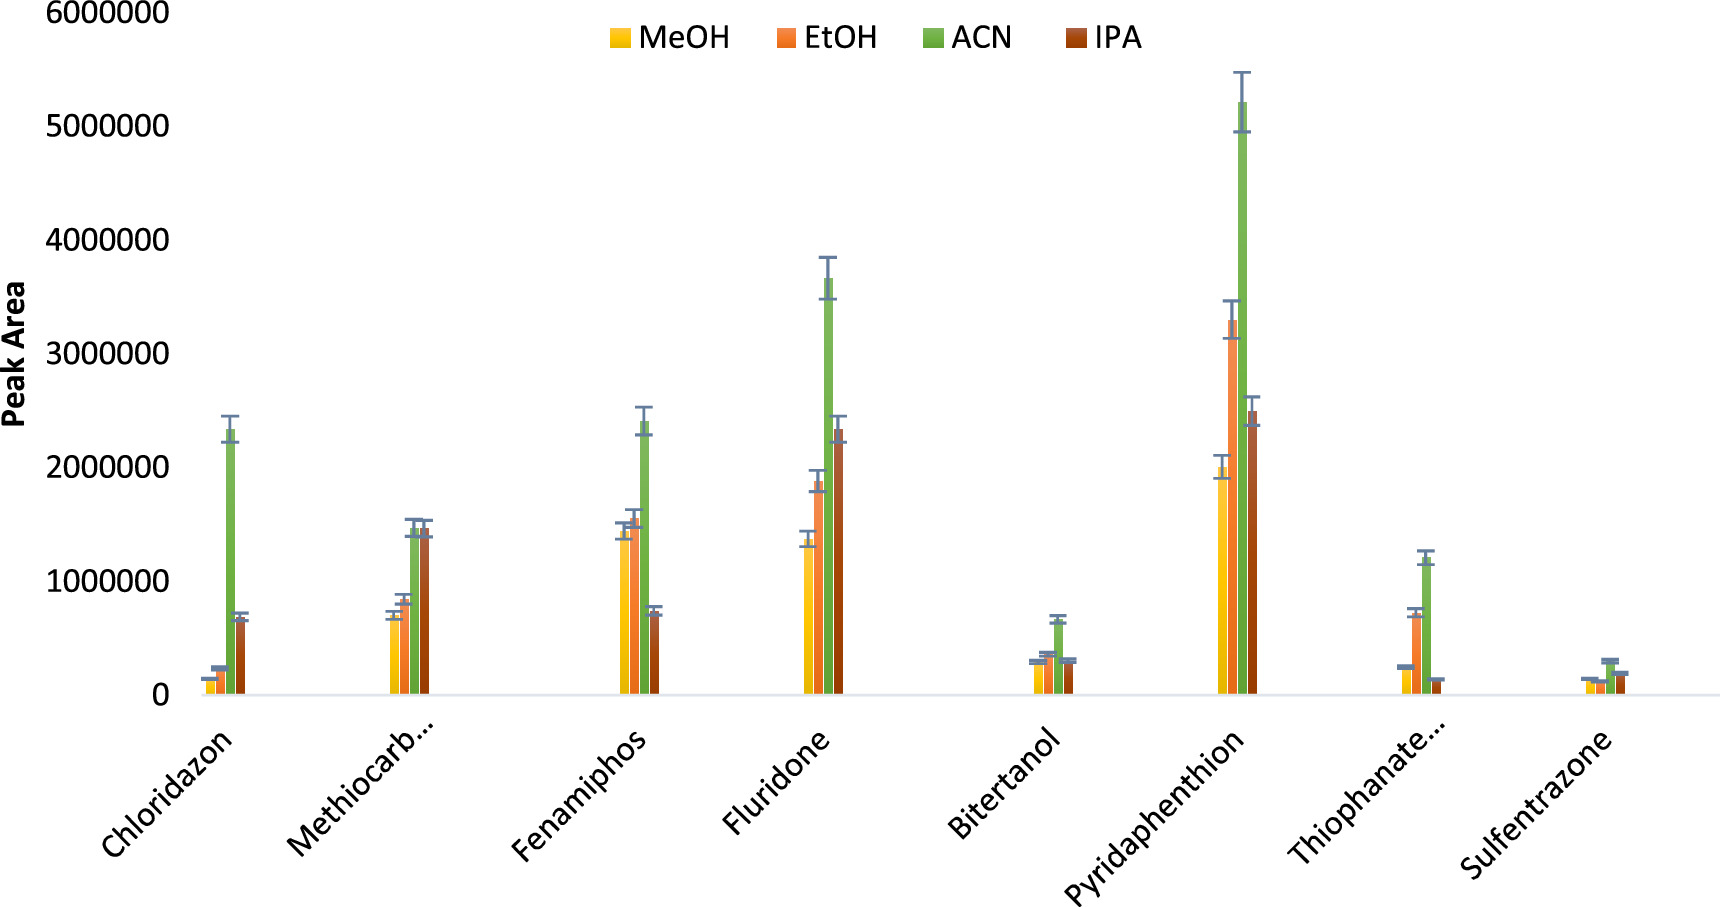
Figure 4. A plot of disperser solvent type versus peak area, n = 3 for error bars (10 μg l−1 aqueous standard, 200 μl of chloroform and 2.0 ml disperser solvent).
Download figure:
Standard image High-resolution image
Figure 5. A plot of disperser solvent volumes versus peak area, n = 3 for error bars (10 μg l−1 aqueous standard and 200 μl of chloroform).
Download figure:
Standard image High-resolution image3.3. Salt effect
The efficiency of a liquid phase extraction method is impacted by the mobility of analytes from the aqueous phase to the organic phase. Inorganic salts are usually added to aqueous solutions to decrease the solubility of analytes and increase their mass transfer into the organic phase. For this purpose, 0.10 g of potassium chloride, sodium sulfate and sodium carbonate were added to aqueous standards and extracted under similar conditions. The peak area values recorded for the different salts were compared to peak area value recorded for a saltless extraction. Even though some salt added extractions recorded peak area values higher than the saltless extraction, the difference was not significant. In addition, one distinct salt did not record optimum extraction outputs for all eight pesticides. Thus, it the optimization experiment was concluded without adding salts to the aqueous solutions.
3.4. Analytical figures of merits
The optimum extraction parameters (table 2) were applied to aqueous standard solutions of the eight analytes prepared in the concentration range of 0.05 μg l−1–100 μg l−1. Selectivity, linearity, recovery, accuracy, precision, limit of detection (LOD), and limit of quantification (LOQ) were examined as method validation parameters. The LOD and LOQ values were calculated to determine the sensitivity of the method. The selectivity was evaluated by comparing the chromatograms obtained with analytes-free (blank) sample and spiked sample injections. No interferences were observed at the retention times of the analytes and internal standard, which indicated that the developed method was selective for the determination of these pesticides in kiwi, mango and pineapple samples. Calibration plots for each analyte were created by comparing the ratio of standard peak area to internal standard peak area versus concentration. The linearity of the calibration plots was observed to have increased when phenytoin was employed as an internal standard, and the percent relative standard deviations (%RSD) calculated for the analytes were less than 10%. Each analyte's linear dynamic range (LDR) was determined using its corresponding calibration curves. The following equations were used to calculate the LOD and LOQ values:
Table 2. Optimum parameters of the dispersive liquid–liquid microextraction method.
| Parameter | Optimum value |
|---|---|
| Extraction solvent type, amount | Chloroform, 200 μl |
| Dispersive solvent type, amount | Acetonitrile, 2.0 ml |
| Mixing type, period | Vortex, 15 s |
| Salt effect | Saltless |
The combination of QuEChERS and DLLME yielded LOD values that fell in the low concentration range of 0.004–0.30 μg l−1. The LDR of the target analytes were very broad ranging from the mid-part per trillion (ppt) level to the mid-part per billion (ppb) level on average. The coefficient of determination (R2) of the analytes were higher than 0.9993, a strong indicator of good linearity over broad concentration ranges. All LOD values calculated for the DLLME- LC-QTOF-MS/MS fell below 0.30 μg l−1. By comparing the LOD values of direct LC-QTOF-MS/MS analysis and DLLME-LC-QTOF-MS/MS analysis, the analytes recorded improvements in LOD values (IMP-LOD) that were in the range of 10–260 folds. The analytical figures of merit including LOD, LOQ, R2, Equations, LDR, %RSD and IMP-LOD determined for the analytes are summarized in table 3.
Table 3. Figures of merit for DLLME/LC-QTOF-MS/MS analyses of analytes.
| Parameter | LOD, μgl−1 | LOQ, μgl−1 | Equation | LDR | %RSD | R2 | IMP-LOD |
|---|---|---|---|---|---|---|---|
| Chloridazon | 0.035 | 0.118 | y = 0.3692x + 0.0344 | 0.10–50 μg l−1 | 5.6 | 1.000 | 14 |
| Methiocarb sulfoxide | 0.017 | 0.057 | y = 0,5764x–0,1098 | 0.05–50 μg l−1 | 7.5 | 0.9998 | 19 |
| Fenamiphos | 0.016 | 0.052 | y = 1,454x + 0,0368 | 0.05–5 μg l−1 | 6.8 | 0.9997 | 11 |
| Fluridone | 0.019 | 0.064 | y = 2,9505x + 0,9157 | 0.05–20 μg l−1 | 4.9 | 0.9993 | 10 |
| Bitertanol | 0.062 | 0.207 | y = 0,0918x–0,0605 | 0.50–50 μg l−1 | 7.3 | 0.9994 | 39 |
| Pyridaphenthion | 0.015 | 0.051 | y = 0,7437x + 0,094 | 0.05–50 μg l−1 | 4.6 | 1.000 | 49 |
| Thiophanate methyl | 0.004 | 0.013 | y = 0,7112x–0,0116 | 0.05–5.0 μg l−1 | 6.4 | 0.9999 | 260 |
| Sulfentrazone | 0.266 | 0.613 | y = 0,0289x + 0,0228 | 0.50–100 μg l−1 | 7.6 | 0.9997 | 19 |
The figures of merit presented in table 3 for this study are lower or similar to figures reported for other studies in the literature. Zheng et al measured the concentration of pesticides residue in fruits and vegetables from Fujian (China) using LC-MS/MS. The LOD and LOQ values reported for thiophanate-methyl were 0.39 μg kg−1, 10 μg kg−1, respectively [31]. Lee et al investigated pesticides residue such as fenamiphos, bitertanol, pyridaphenthion in sweet pepper (capsicum annuum), where the LOD and LOQ values for the LC-MS/MS system were reported in the ranges of 0.03–0.5 μg kg−1 and 0.6–1.5 μg kg−1, respectively, whereas GC-MS/MS values were in the ranges of 0.9–2.0 μg kg−1 and 3.0–5.7 μg kg−1, respectively. The findings show that the simultaneous analysis is a reliable approach for the evaluation of pesticide residues [32]. Sancar et al analyzed vegetables and fruits sample from İstanbul, one of the most populated cities in Turkiye, using LC/MS-MS. QuEChERS extraction method was used to for the sample preparation. The LOQ value for selected pesticides including chloridazon, fenamiphos, methiocarb sulfoxide, bitertanol was calculated as 0.01 mg kg−1. In comparison to this study, the LOQ values of chloridazon, fenamiphos, methiocarb sulfoxide and bitertanol after the combined QuEChERS and DLLME methods ranged between 0.05 and 0.21 ng ml−1. Although pesticide levels were found in 43% of their samples, the maximum legal contaminant level was recorded in 7% of those samples [33].
Shabeer et al evaluated agrochemical residue in raisins using buffered ethly acetate extraction and liquid chromatography tandem mass spectrometry. The target analytes were extracted using ethly acetate and clean up with dispersive solid phase extraction was carried out by primary secondary amine sorbent. The regulatory default MRL was set at 10 ng g−1, and the LOQ values varied from 0.01 to 10 ng g−1, with recoveries of 70%–120% and 20% RSD for 93.5% of substances. The LOD/LOQ values of bitertanol, chloridazone, fenamiphos, sulfentrazone and thiophanatemethyl were reported as 0.63/1.90 ng g−1, 0.23/0.70 ng g−1, 0.023/0.070 ng g−1, 0.67/2.00 ng g−1 and 0.67/2.00 ng g−1, respectively [34].
Shin et al detected pesticides in spinach, rice and mandarin matrices using LC-MS/MS and compared the QuEChERS method and traditional LLE method. The LOD values calculated for the selected pesticides (bitertanol, chloridazone, fenamiphos, fluridone, pyridaphenthion and sulfentrazone) were in the ranges of 0.06–3.03 μg kg−1 and 0.03–3.03 μg kg−1 for the QuEChERS and LLE methods, respectively [35].
The figures of merit for these comparative studies are summarized in table 4.
Table 4. Comparison of the results of this study with the studies in the literature.
| Sample | Analytes | Extraction Procedure | Analytical Method | LOD/LOQ | Recovery | References |
|---|---|---|---|---|---|---|
| Fruits and vegetables | Thiophanate-methyl and 44 pesticides residue | QuEChERS | LC-MS/MS | 0.02–1.90 μg kg−1 / 10 μg kg−1 | 72.0%–118.0% | [31] |
| Sweet pepper | Fenamiphos, bitertanol, pyridaphenthion | QuEChERS | LC-MS/MS | 0.03–0.50 μg kg−1/ 0.6–1.5 μg kg−1 | 70.0%–120.0% | [32] |
| Vegetables and fruits | Selected pesticides such as chloridazon, fenamiphos, methiocarb sulfoxide, bitertanol | QuEChERS | LC-MS/MS | The LOQ value of pesticides was found 0.01 mg kg−1 | 76.5% and 115.5% | [33] |
| Fresh tomatoes | 12 insecticide and 12 fungicide | A modified version of QuEChERS | LC-MS | 0.001–0.20 mg kg−1/ 0.020–0.60 mg kg−1 | 71.3%–112.3% | [36] |
| Raisins | Selected pesticides bitertanol, chloridazone, fenamiphos, sulfentrazone and thiophanatemethyl | A buffered ethyl acetate extraction method | LC-MS/MS | 0.023–0.67 ng g−1 / 0.07–2.00 ng g−1 | 70.0%–120% | [34] |
3.5.Application of the proposed method to tropical fruits
Pineapple, kiwi and mango were used as test samples to evaluate the accuracy of the developed method and its applicability to real samples. Fruits are known to contain several organic and inorganic compounds that may hinder or boost the signal of analytes. The difference between the response of an analyte in a standard solution and in a sample matrix is known as 'matrix effect' [37]. Matrix effects can have an impact on target analyte signals in complex samples, especially when electrospray ionization is utilized [38]. The matrix factor value was used to assess the matrix effect on the analytes and it was calculated with the equation below:

Herein, MF=1 implies there are no matrix effects, MF > 1 implies ion enhancement and MF < 1 implies ion suppression [39].
In this study, the matrix factor was found to be in the range of 0.067–0.072, 0.64–1.71, 0.29–1.90 for pineapple, kiwi, and mango samples, respectively. This implies that the analytes with MF values lower than 1.0 would be under-estimated and those with MF values higher that 1.0 would be over-estimated.
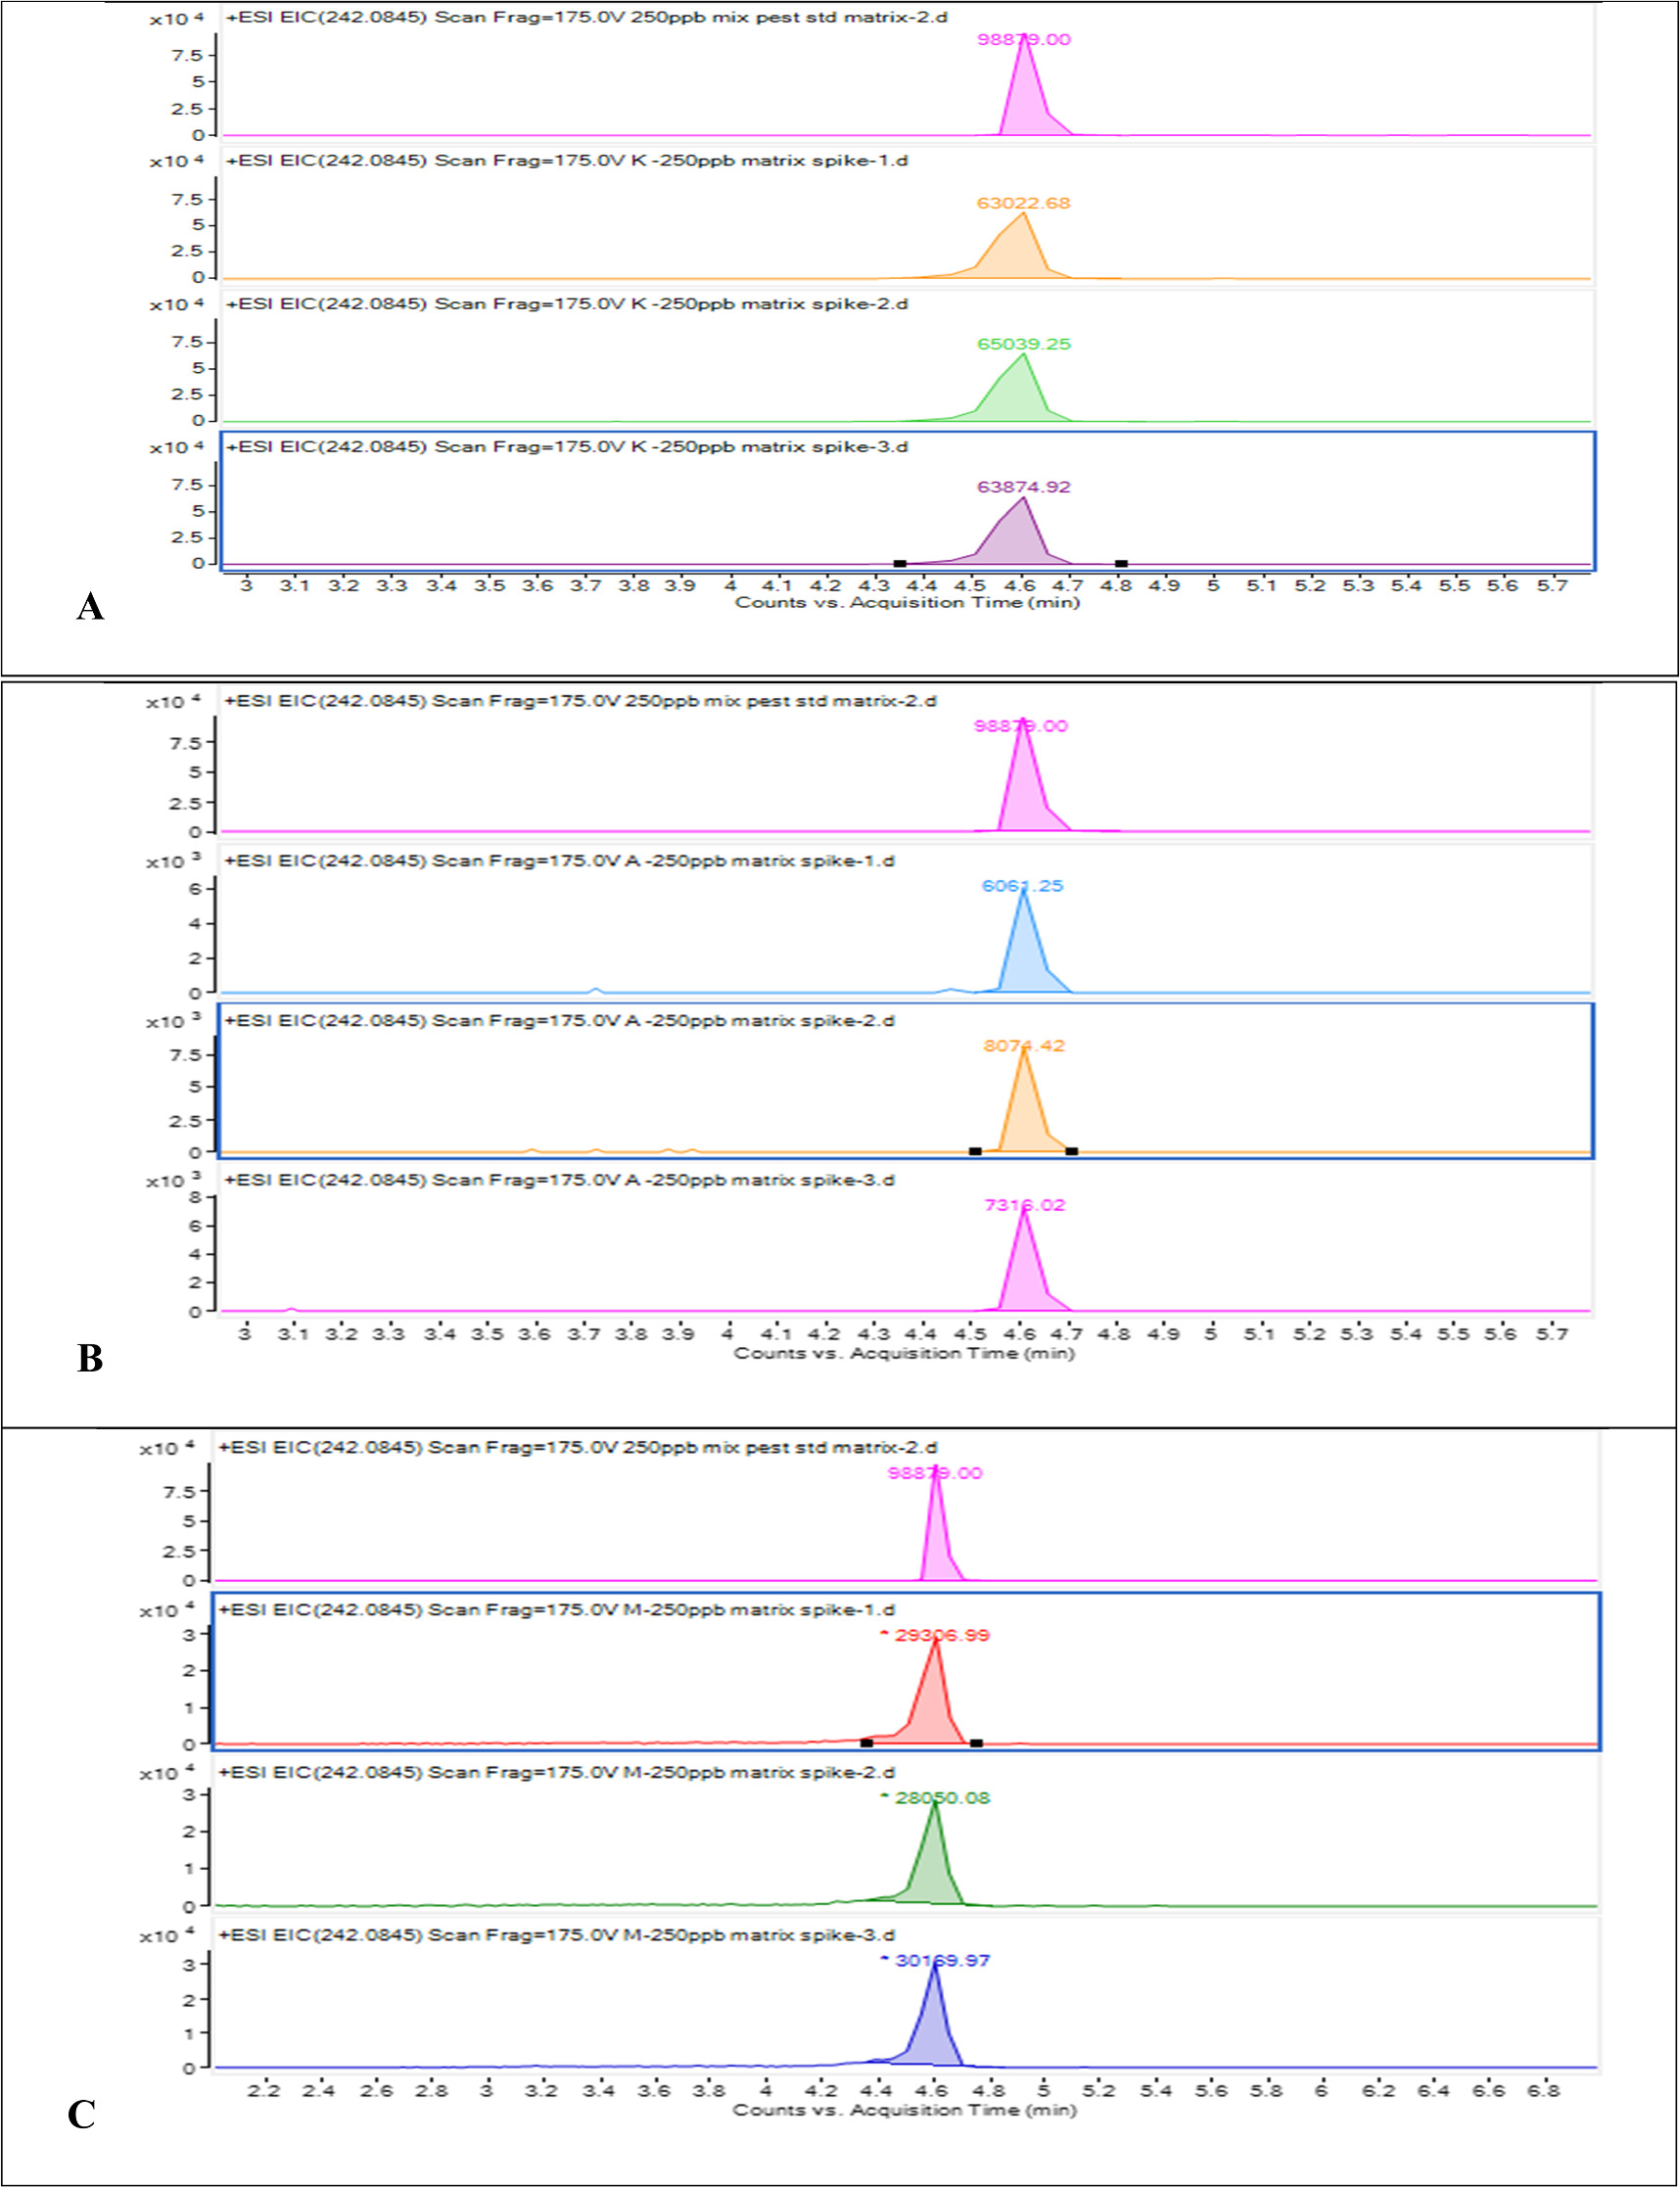
The extracted chromatogram showing the compared peak areas of the mixed standard solution with mango, pineapple, kiwi samples analyzed in triplicate is given in figure 6. In order to mitigate the effects of the complex sample matrices, matrix matching calibration was used to quantify the analytes in the three sample matrices. Prior to using extracts of the fruit samples to prepare the matrix matched calibration standards, blank analyses were performed to ensure that the analytes were not present, or perform blank correction when detected. No analytical signals were observed at the retention times of the analytes, indicating the absence of the analytes or concentrations below the limits of the method.
Figure 6. A. Extracted ion chromatogram of methiocarb sulfoxide in 250 μgl-1 mix standard solution and kiwi sample. B. Extracted ion chromatogram of methiocarb sulfoxide in 250 μgl-1 mix standard solution and pineapple sample. C. Extracted ion chromatogram of methiocarb sulfoxide in 250 μgl-1 mix standard solution and mango sample.
Download figure:
Standard image High-resolution image
Matrix matching calibration standards were prepared in the linear range of the analytes and the linear equations of the calibration plots were used to quantify the spiked samples.
Acceptable percent recovery values (89%–117%) were obtained for all analytes at two different spike levels for each sample, as summarized in table 5.
Table 5. Matrix matched percent recoveries for kiwi, mango and pineapple samples.
| Chloridazon | Methiocarb sulfoxide | Fenamiphos | Fluridone | |||||
|---|---|---|---|---|---|---|---|---|
| Mango | 0.75 ng ml−1 | 15 ng ml−1 | 1.5 ng ml−1 | 30 ng ml−1 | 0.75 ng ml−1 | 1.5 ng ml−1 | 0.75 ng ml−1 | 1.5 ng ml−1 |
| 94.19 ± 7.02 | 93.98 ± 5.90 | 96.50 ± 7.21 | 89.19 ± 6.66 | 97.50 ± 7.20 | 102.3 ± 2.1 | 97.50 ± 4.85 | 102.3 ± 5.1 | |
| Pineapple | 0.75 ng ml−1 | 15 ng ml−1 | 1.5 ng ml−1 | 30 ng ml−1 | 0.75 ng ml−1 | 1.5 ng ml−1 | 0.75 ng ml−1 | 1.5 ng ml−1 |
| 91.31 ± 2.26 | 92.83 ± 4.42 | 93.27 ± 2.75 | 94.90 ± 0.36 | 93.16 ± 2.87 | 102.0 ± 5.2 | 90.91 ± 4.52 | 102.1 ± 5.1 | |
| Kiwi | 0.75 ng ml−1 | 15 ng ml−1 | 1.5 ng ml−1 | 15 ng ml−1 | 0.75 ng ml−1 | 1.5 ng ml−1 | 0.75 ng ml−1 | 1.5 ng ml−1 |
| 96.58 ± 7.21 | 106.43 ± 7.95 | 94.89 ± 4.10 | 106.4 ± 7.9 | 98.81 ± 6.75 | 106.4 ± 7.3 | 94.57 ± 4.70 | 105.9 ± 5.3 | |
| Bitertanol | Pyridaphenthion | Thiophanate methyl | Sulfentrazone | |||||
| Mango | 1.5 ng ml−1 | 15 ng ml−1 | 0.75 ng ml−1 | 15 ng ml−1 | 1.5 ng ml−1 | 3 ng ml−1 | 1.5 ng ml−1 | 15 ng ml−1 |
| 89.65 ± 6.57 | 96.93 ± 7.10 | 95.72 ± 8.69 | 104.3 ± 3.1 | 116.1 ± 7.4 | 90.77 ± 5.80 | 105.8 ± 8.1 | 90.00 ± 6.88 | |
| Pineapple | 1.5 ng ml −1 | 15 ng ml −1 | 0.75ngmL −1 | 15 ng ml −1 | 0.75 ng m l −1 | 1.5 ng m l −1 | 1.5 ng m l −1 | 15 ng m l −1 |
| 102.3 ± 2.8 | 92.00 ± 3.48 | 97.68 ± 3.04 | 99.53 ± 6.04 | 92.03 ± 2.04 | 101.9 ± 0.6 | 97.32 ± 7.44 | 94.15 ± 7.19 | |
| Kiwi | 1.5 ng m l −1 | 15 ng m l −1 | 0.75 ng m l −1 | 15 ng m l −1 | 0.75 ng m l −1 | 3 ng m l −1 | 1.5 ng m l −1 | 15 ng m l −1 |
| 94.49 ± 2.09 | 107.7 ± 0.9 | 105.8 ± 1.5 | 106.6 ± 0.2 | 113.2 ± 7.2 | 100.7 ± 6.4 | 97.32 ± 7.44 | 94.15 ± 7.19 | |
4. Conclusion
This study presents the combination of QuEChERS and DLLME, two superior tools that allowed effective sample clean-up and preconcentration of selected pesticides for their determination by LC-QTOF-MS/MS. The DLLME method was thoroughly optimized to enhance the extraction efficiency for the analytes and using these optimum conditions, very low detection limits were recorded below 0.30 μg l −1. The calibration plots of the analytes covered broad dynamic ranges and showed very high linearity. Mango, pineapple, and kiwi fruit samples were used to validate the developed method's applicability and accuracy for real samples. A comparison of spiked samples to standard solutions revealed significant matrix interference on the analytes. Matrix matching calibration method was used to overcome these matrix effects and this resulted in percent recovery results in the range of 89%–117%. The results showed that the proposed method is feasible for the determination of pesticides with high accuracy and precision.
Acknowledgments
The authors would like to mention that they have submitted this research to Yildiz Technical University in part completion of the criteria for a PhD degree. The authors are grateful for the financial assistance from Yıldız Technical University (Scientific Research Project, FDK-2020–4076).
Data availability statement
The data cannot be made publicly available upon publication because no suitable repository exists for hosting data in this field of study. The data that support the findings of this study are available upon reasonable request from the authors.
Competing interests
The authors declare that they have no competing interests.
Author statement
Sabriye Sel: Methodology, Validation, Formal Analysis, Investigation, Writing- original draft. Elif Öztürk Er: Methodology, Validation, Formal Analysis, Investigation, Writing- original draft. İkbal Koyuncu: Conceptualization, Resources, Supervision, Project Administration, Writing-editing.