
Abstract
The wavelength-ratiometric techniques demonstrate strong advantages in fluorescence sensing and imaging over techniques employing variations of intensity at single wavelength. We present different possibilities for realization of these advantages in different simplified, miniaturized and multiplexing devices. They include the smartphone-based detection systems and strips, in which the color changes are observed with naked eye. The array-based techniques and different immunoassays with λ-ratiometric detection demonstrate strongly increased stability and sensitivity. The application areas extend from on-site monitoring of environment and point-of-care diagnostics to testing in personal need. Selected examples of sensing different analytes in chemical and biological systems demonstrate multiple possibilities of coupling the analyte-sensor interaction with the generation of λ-ratiometric output signal. Among them, simultaneous detection of several analytes and performing logical operations that can be useful in analysis. Finally, the benefits of multicolor ratiometric fluorescence imaging are demonstrated by visualization the functionally important parameters of biological membranes.
Export citation and abstract BibTeX RIS

Original content from this work may be used under the terms of the Creative Commons Attribution 4.0 licence. Any further distribution of this work must maintain attribution to the author(s) and the title of the work, journal citation and DOI.
1. Introduction
Fluorescence methods being the most popular in sensing techniques are the subjects of substantial improvement. In Pt. I of these series [1] we explained the weak points of fluorescence intensity measurements at single wavelength. The sensor response signal when it is based on increase (OFF-ON) or decrease (ON-OFF) of intensity is measured in relative units that are proportional to the number of emitted quanta in given experimental conditions and have no absolute value. For instance, without proper calibration it is not possible to compare the results of analyte determination obtained with different concentrations of fluorescence reporters or on different instrumentation. Likewise, in cellular images it is hard to recognize if the image is formed by the distribution of analytes or by the distribution of fluorescent sensors themselves.
The recording of fluorescence intensity at two or more emission wavelengths may be considered as the simplest way without measuring the whole spectra to extract the important information that they contain. In analytical science, it allows removing the problems existing with sensors based on single-channel recording of fluorescence, and the simple procedure of obtaining the intensity ratios (the wavelength λ-ratiometry) may be sufficient for that [2–4].
Technically, switching the wavelength of bright emission between free and analyte-bound state of the sensor can be obtained in different ways. It can originate from a single dye changing the energy of its electronic transition. It can also be the switching of emission energy as a result of change in interaction between two or several dyes. Moreover, the introduction of inert but brightly fluorescent reference dye can be a satisfactory solution. Thus, the first aim of λ-ratiometry is the improvement of analytical data, elimination or reduction of many artifacts coming from uncontrolled quenching of fluorescence, degradation of the dyes or variation of instrumental factors [5].
The success in recent developments of color-changing fluorophores and detection techniques has put forward the second aim—to develop the most efficient strategy of analysis and visualization of output data [6]. The timely sensing and effective monitoring of different targets is needed in various fields such as clinical diagnosis, environmental management, food/drug quality control, safety monitoring, security screening, etc The instruments should be portable and easy to use. The quantitative analyte detection should end with the results easily understood not only by professionals but also by the large army of consumers. Therefore, display of this information in real or artificial color has proved to be the most efficient way for comprehension and making decisions.
Below we concentrate on technical aspects of realization of λ-ratiometry, demonstrating its strong advantage. Here the result can be obtained with very simple instrumentation, even using the screen of smartphone or just by naked eye. When applied to microarrays and different types of immunoassays, this technique is attractive for on-site monitoring of environment and for point-of-care diagnostics, and its paper strips versions even for personal use. Selected examples from extremely broad field of applications in chemical and biological systems demonstrate different possibilities of λ-ratiometric signal generation. The ability of performing logical operations with multi-color fluorescence output establishes the link between sensing and computing on molecular level. Finally, the benefits of λ-ratiometry in fluorescence imaging are demonstrated by visualization of functionally important parameters of membranes in living cells.
2. Modern technical realization of λ-ratiometry
Until present, most quantitative analyses in clinics and control of food quality are carried out with the assistance of expensive laboratory instruments and skilled persons. They are time-consuming and not suitable for real-time and on-site assays. The same happens with the studies of environment. The samples are collected, and then brought to laboratories for analyzes. It is an urgent necessity to develop the strategy for a simple, rapid and sensitive detection of target analytes.
2.1. Broad-scale instrumentation
The high-quality spectroscopic instrumentation is needed only on the steps of fluorescence assay development. The choice and testing of fluorescence reporters by their spectroscopic parameters is the necessary procedure. As we will see below, the spectroscopic changes on sensor events are frequently presented in original publications. Then, the simplified version of the technology is described that involves collecting the emission at selected wavelengths or even visual detection.
The λ-ratiometric signal is easily detectable in all instrumental formats (fluorimeters, microscopes, flow cytometers, plate readers, etc) by selecting the filters on fluorescence channels. Simple low-cost ratiometric fluorimeters are known for many years [7]. Diode lasers and digital color cameras [8] introduced compact design and substantial improvement of performance. Modern industry producing optical instruments is oriented on manufacturing of compact handheld and specializes devices [9]. Development of various lab-on-a-chip techniques [10] allowed achieving miniaturization, integration and systematization of various sensor types together with their multi-analyte monitoring in parallel.
A variety of friendly for personal use pocket-size instruments has appeared [11, 12], and the colored smartphone matrices were found ideal for providing the λ-ratiometric output. Recording the ratio of intensities between spectrally resolved emission bands becomes the most precise procedure.
2.2. Color-changing paper-based sensors
Paper-based sensors are simple to manufacture, inexpensive, portable and disposable. They are quite applicable for diagnostics, human activity monitoring, food safety and environmental detection [13]. The filter paper or microporous membrane can be used as support for printing the fluorescent probes. By immobilizing or dripping λ-ratiometric fluorescent probes onto the surface of solid substrates or incorporating into their porous volume, it is easy to operate with them for realizing the real-time visualized color detection. The novel fluorescent materials, particularly nanomaterials, allowed achieving the brightness sufficiently high for detection together with their wavelength-shifting capability.
However, an important weakness of visual detection is apparent. It can be imprecise due to color mixing [14], since two primary colors can produce an intermediate color, making hard to estimate the contributions of primary colors. It is even harder to operate visually with three-color response [15, 16]. That is why it is important to reduce the effect of color mixing by proper choice of reporters with optimal spectral resolution and optimal spectral location of 'pure colors'. Though a progress has been achieved in visual analysis with paper-based sensors, it is difficult to reach satisfactory sensitivity and accuracy just because our naked eyes are unable to distinguish a slight color change.
Still, the proper choice of analyte-responding and reference fluorophores and the broadest spectral difference of their fluorescence colors may allow achieving good results in visual color-changing analyte detection [17]. Thus, a profuse color-evolution-based fluorescent test paper sensor for rapid and visual monitoring of Cu2+ ions in human urine was suggested [15]. It uses the tricolor probe system, selected for optimal visual perception (figure 1). Upon the addition of different amounts of Cu2+, the ratiometric fluorescence intensity of this probe varies continuously, leading to color changes from shallow pink to blue with a detection limit of 1.3 nM. The test is simple, rapid and inexpensive. A portable UV lamp is only needed for the detection of target analyte by the naked eye.
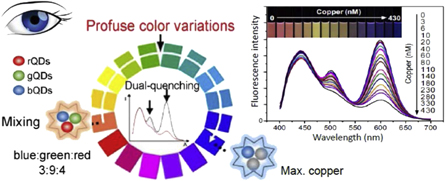
Figure 1. Visual test for Cu2+ ions in urine based on printing tricolor probe onto filter paper and visual detection [15]. The tricolor probe consists of blue-emission carbon dots (bCDs), green-emission quantum dots (gQDs) and red-emission quantum dots (rQDs). The fluorescence of gQDs and rQDs is quenched by Cu2+, whereas the bCDs as the photostable internal standard is insensitive to Cu2+. The presence of these ions in nanomolar concentrations provides the visual color change for almost the whole visual spectrum.
Download figure:
Standard image High-resolution image2.3. The use of smartphone-based detectors
Smartphones have become a part of everyday life. In addition to the ability to make voice calls, they allow using high-resolution cameras, providing data processing, presentation and exploring internet connectivity. Their transformation into multi-channel fluorescence detectors can be easily done with incorporation of diffraction gratings or filters [18]. Using smartphones or their CMOS matrices as detector units, the very inexpensive spectrofluorimeters [19], fluorescence imagers [20] and microscopes [21] were developed. They change the performance of paper strip-based, microfluidic and immunoanalytical techniques and provide easy analysis of microarrays.
The digital imaging features of smartphones make them the outstanding analytical platforms for realizing ratiometric fluorescent strategies to develop the handheld and point-of-care testing sensors. They offer an effective way to establish warning-early mechanisms against environmental and food safety risks, safeguarding public health [22]. Typically for λ-ratiometric detection, two emitters are involved, in one of which the fluorescence is quenched/enhanced in sensing process with a strong change of detected emission color [23, 24]. For quantifying the target concentration with a smartphone, the intensity variations of three primary colors (red-green-blue, RGB) can be transformed into intensity ratio of different colors, such as R/G.
In fact, any mobile device can be easily turned into a portable fluorescence light detector by developing simple accessories that create a mini-darkbox around the photocamera, preventing ambient light from interfering with the test's light signal [25]. At present, most reported smartphone sensing processes rely on the dark environmental conditions. Very recently, 3D-printing technology was introduced to integrate with smartphone all necessary optical elements [26].
The smartphone-based sensing platform combined with a paper strip was suggested for the detection of pesticides in fruits in real-time/on-site conditions [27]. It was integrated with a UV lamp and dark cavity by 3D-printing technology and allows visual quantitative detection of pesticide with a dual-emissive ratiometric paper strip (figure 2). Red-emitting CdTe quantum dots (rQDs) were embedded into the silica nanoparticles (SiO2 NPs) as an internal reference, while blue-emitting carbon dots (bCDs) as a signal report unit were covalently linked to the outer surface of SiO2 NPs. The blue fluorescence is quenched by gold nanoparticles (Au NPs). Then it is recovered when they dissociate under the interaction with pesticide. The red, green and blue channel values of the generated images were determined by a color recognizer application (APP) installed in the smartphone, and the red/blue values could be used for pesticide quantification with a sensitive detection limit (LOD) of 59 nM.
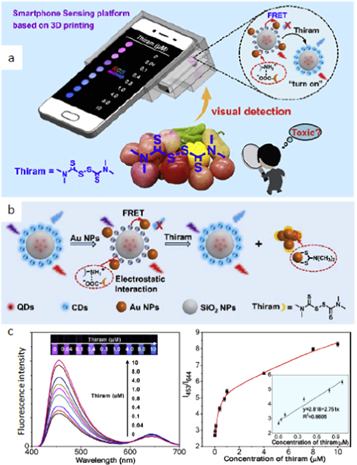
Figure 2. Portable smartphone platform using a fluorescent paper strip for visual quantitative ratiometric sensing [27]. (a) Illustration of general principle of detecting pesticide thiram in fruit species. (b) The visual detection principle for thiram with a single dual-emissive ratiometric probe rQDs@SiO2@CD. (c) Fluorescence spectra (λex = 350 nm) of this probe with the addition of different concentrations of thiram. The inset photo shows the corresponding fluorescence photographs under a 365 nm UV lamp. Fluorescence intensity ratio (I453/I644) of the λ-ratiometric probe solution shows the dependence on concentration of thiram with its linear section from 0 to 1 μM (inset).
Download figure:
Standard image High-resolution image2.4. Immunoassays
It is commonly recognized that enzyme-linked immunosorbent assays (ELISAs) or related fluorescence sandwich immunoassays that are presently applied to a broad range of clinically relevant analytes do not fit for point-of-care applications since they do not satisfy the requirements for speed, low cost, and ease of use [28]. Possessing the advantages of high specificity and sensitivity, they require multiple steps performed by skillful personnel: washing, incubation, external calibration, reagent addition and optimization of assay conditions. Ideally, a diagnostic test should be such that it could be performed anywhere, regardless of facilities [29].
Lateral flow immunoassays (LFIAs) were introduced as cheap and relatively easy-to-use point-of-care tests that are configured to mimic a heterogeneous ELISA-like workflow by use of capillary action to separate bound from unbound material. It allows to capture the analyte-specific detection signal avoiding the sample-to-lab transition and the need for multiple wash steps [30]. However, the LFIAs suffer from limited sensitivity, and their primary use is only as qualitative tests [31]. Most attempts for their improvement were made to increase the brightness of reporting signal for making it visible by naked eye or recorded by simple instrumentation [30].
Several recent publications demonstrated strong improvement of LFIA test sensitivity when, instead of single-color detection, a λ-ratiometric approach was realized. The scheme for such test that allows the naked eye semi-quantitative readout of aflatoxin M1 concentration is presented in figure 3 [32]. Utility of such approach was also demonstrated on detection of immunoglobulins (IgG) [33]. The red-fluorescent CdSe@ZnS quantum dots (655-QDs) were modified with target-specific antibodies, and the target-independent blue fluorescent polystyrene nanobeads (450-NBs) were immobilized on the test line together with these antibodies. The presence of the target and the subsequent immune-sandwich formation induced the accumulation of the 655-QDs. It was possible to generate a wide color palette (blue, purple, pink, red) on the test line informing on analyte concentration.

Figure 3. The fluorescent lateral flow immunoassay competitive hue recognition [32]. The ratiometric change of emission arises from the overlap of fluorescence signals of two nanocomposites tagged with probe antibodies and coated antigens. A visually discernible fluorescence color change allows yielding a visible detection limit of 0.02 ng ml–1.
Download figure:
Standard image High-resolution imageThere were many attempts to develop homogeneous immunoassays, in which the reversible interaction (molecular recognition) based on affinity between antigen and antibody could provide direct response rapidly and in one step [29, 34]. The problem is that the signal generation should be directly coupled with molecular recognition and demonstrate sufficiently bright change in self-referenced parameter of fluorescence emission.
Regarding highly needed detection of antibodies, different suggestions were made on the generation of ratiometric signal in response to binding of analyte antibody with molecular constructions that contained the antigenic site (epitope). In a flexible peptide that incorporates the epitope of 3–4 amino acids in length and terminates from both sides with pyrene groups, these groups may form excimers that become disrupted on interaction with antibody (figure 4). Thus, the λ-ratiometric signal comes from switching between excimer and monomer emissions [35]. Disruption of close interaction between FRET donor and acceptor (that can be presented by two fluorescent proteins) may occur if the extended link between them allows binding to two sites of Y-shaped bivalent antibody [36]. The FRET system can also be formed on binding to the same antibody of two peptides, one containing the donor, and the other the acceptor [37].

Figure 4. Illustration of several possibilities for direct sensing of molecular interactions of specific antibodies with their molecular recognition sites (epitopes). (a) Epitope is incorporated in a linker between two pyrene groups that allows λ-ratiometric detection of excimer-monomer transition. (b) Interaction between forming FRET pair fluorescent proteins is disrupted on binding to two sites of bivalent antibody. (c) Two interacting peptides labeled with donor and acceptors bound to antibody may interact between themselves forming the FRET pair.
Download figure:
Standard image High-resolution imageA prototype of λ-ratiometric sensor based on peptide labeled with λ-ratiometric 3-hydroxychromone dye was developed [38]. Using a model of high-affinity interaction between an 18-aminoacid antigenic peptide derived from tobacco mosaic virus coat protein and a recombinant antibody fragment, Fab 57P, a dramatic change of fluorescence spectrum was observed. Due to ESIPT reaction, the ratio of intensities of two bands (IN*/IT*) in the dye fluorescence spectrum changed dramatically (from 0.92–0.94 to 0.60) and remained unchanged in the presence of nonspecific fragments (figure 5).
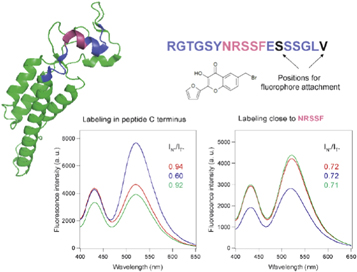
Figure 5. Synthetic peptide labeled with λ-ratiometric dye for specific detection of antibodies [38]. The peptide representing the antigenic segment 134–151 of tobacco mosaic virus protein (shown in pink in peptide sequence) interacts with the specific antibody fragment Fab57P as a model target. The pink part of the sequence corresponds to the antigenic binding site for Fab57P. The segment of protein structure and the corresponding peptide sequence are shown in the same color code. Below are the fluorescence spectra of the λ-ratiometric 3-hydroxychromone dye (FC) covalently attached to indicated sites in the absence (red) and at the presence (blue) of saturating amounts of specific antibody fragment Fab57P. (a) The mutant V151C-FC. The spectra change dramatically on target binding with the decrease of fluorescence ratio between the two bands (IN*/IT*) from 0.94 to 0.60. (b) The mutant S146C-FC. The ratio of fluorescence intensities does not change. The F(ab')2 fragment with unrelated specificity (green) was used as a negative control.
Download figure:
Standard image High-resolution image2.5. Microarray techniques
The spotted microarrays are the assemblies of a great number (hundreds and thousands) of sensor instruments, in which every instrument is represented by a spot on a surface formed by the deposition of one type of sensor molecules or particles. The read-out of reporter signal is made using the specialized fluorescence microscope instruments—the microplate readers. The analyzed sample is exposed to whole microarray, so the binding of different targets to correspondent sensor instruments occurs in essentially the same conditions. Sensor arrays can detect many analytes simultaneously, adapt to several analyte concentration ranges, provide multi-analyte comparison between the samples, realizing the 'chemical nose/tongue' approach [12, 39].
Implementing the two-color readout is important for improving the performance of array-based technique [40], which was shown in high-throughput analysis of proteins [41], disease markers [42] and pathogenic microbes [43]. The attempts to provide multicolor fluorescence reporting were based on 'sensing-with-the-reference' concept, combining two OFF-ON and ON-OFF responses [44], arranging the FRET pairs [45] and ESIPT reactions [43].
For tracing dopaminergic agents that are important in diagnosis of Parkinson's disease in human urine, a fluorescence multicolor electronic tongue was developed [42], figure 6(a). A smartphone camera was used to take photos from the solutions in the wells. Distinct changes in the spectral profiles along with vivid and concentration-dependent color variations led to visual discrimination of dopaminergic agents in a broad concentration range.

Figure 6. Pattern of arrays with ratiometric fluorescence detection and the analysis of obtained data. (a) Visual and fingerprint fluorimetric patterns created by a sensor array to simultaneously detect and discriminate among dopaminergic agents levodopa, carbidopa, benserazide, and entacapone [42]. A dual emissive nanoprobe consisted of red CdTe QDs and blue CDs provide unique emission patterns in the presence of the target analytes. A linear discriminant analysis was performed after pattern recording with smartphone. (b) Identification of bacterial pathogens based on the pattern formed by the binding and color-changing response of 3HC dye exhibiting the ESIPT reaction [43]. Multivariant analysis was applied based on the concept of chemical nose.
Download figure:
Standard image High-resolution imageSensor arrays based on small molecules offer a chemically stable and cost-effective alternative identification of pathogenic microorganisms. The outstanding properties of 3HC dyes to provide an ESIPT-based dual-channel ratiometric response, allowed by using discriminant analysis of the sensor array responses, effective distinguishing between eight bacterial species and recognition of their Gram status [43], see figure 6(b).
Thus, a rainbow of switchable colors of easily generated and recorded fluorescence can be transformed into informative analytical signals with the present-date instrumentation adapted for particular assay. Miniaturization of all optical elements and their fabrication from inexpensive materials and in the form of integrated units are the present tendencies in instrument design. Even in the simple versions of the λ-ratiometry that sometimes look primitive, this concept competes successfully with lifetime and anisotropy techniques that also allow instrument-independent output but use a more complicated type of measurement. New designs and new improvements continue.
3. Overview of selected analytical applications
A rapid development of ratiometric probes is observed for sensing and imaging of different analytes that are essential for different areas, from life sciences to environmental monitoring. Selected examples presented below illustrate essential features of λ-ratiometry as a technique with strong potential for providing precise quantitative analyses.
3.1. The sensing and imaging of pH and ions in biological systems
The appearance of new bands in absorption and fluorescence spectra as a function of proton dissociation/association in organic dyes is basic in versatile measurements of pH [46]. In the collection of many organic dyes, one may find those changing the emission color in neutral and weakly alkaline pH range [47] or at strongly acidic pH [48]. The fluorescence spectra of one of the dyes titrating in low pH region are presented in figure 7 [49].

Figure 7. The λ-ratiometric sensor for low pH region [49]. The dye DIDBA emits light demonstrating two bands in the red and near-IR range of spectrum. Excitation was at the isosbestic point 495 nm. The pKa value was calculated from the pH dependence of λ-ratiometric fluorescence intensity (F618nm/F697nm). Sigmoidal fitting yields pKa = 4.5 (insert).
Download figure:
Standard image High-resolution imageMultiple titrating groups and more complicated reaction schemes can be introduced for extending the pH range [50], up to extreme acidic and alkaline values [51]. The need of operation in different detection formats and increased requirements towards chemical stability and photostability of the probes stimulated development of pH-sensing nanostructures [46]. Incorporation into polymer nanoparticles of dyes with different pH range of response allowed extending the dynamic range of pH measurements [52, 53]. Extending the pH range and improvement of performance was also achieved with dual-emitting functionalized gold nanoclusters [53] and metal-organic frameworks [54]. The sensitivity sufficient for visual detection of change in emission color was achieved for some of these structures [55].
Intracellular pH, especially cytoplasmic pH (~7.2) plays a crucial role in cell functions and metabolism, and a number of λ-ratiometric probes were designed for these studies [47, 56, 57]. The pH values in different organelles differ from cytoplasmic pH and their study is of special importance but needs the probes with high affinity to these organelles. There are the λ-ratiometric pH sensors for mitochondria that operate in neutral-alkaline pH range [58]. In contrast, pH in lysosomes is variable in acidic range, and a number of probes were developed for detecting and analyzing these variations [59, 60]. A bicolor fluorescence imaging becomes efficient tool in cellular research [61].
Metal cations are very important for biology and medicine. These include sodium (Na+) potassium (K+), calcium (Ca2+), magnesium (Mg2+), copper (Cu+ and Cu2+) and zinc (Zn2+) ions. Health and environmental problems may be caused by toxic metal ions, such as lead (Pb2+), cadmium (Cd2+) and Mercury (Hg2+). Perturbation by their charge of π-electronic structure of organic dyes resulting in the appearance of intramolecular charge transfer (ICT) bands is the general principle of generation their λ-ratiometric response [62, 63]. The sensors based on formation of intramolecular and intermolecular excimer complexes or excited-state energy transfer between molecular fragments have also been developed.
The reader is strongly advised to study original paper of Roger Tsien [64] on the development of the first λ-ratiometric Ca2+ probes FURA-2 and INDO-1 (figure 8). In these stilbene-like dyes, the bound Ca2+ ions interact with the electron-donor nitrogen atom incorporated into the fluorophore. Strong electrostatic interaction with the ion generates a new ground-state form with its light absorption and excitation band shifted to shorter wavelengths. The two forms with bound and unbound analyte behave as different species, and the Ca2+ binding-release results in interplay of two excitation spectra. The BAPTA sites serve as the ion chelating groups. The binding of Ca2+ to these sites in water, shifts the excitation spectra of FURA-2 and INDO-1 to blue, allowing the excitation-based ratiometry.

Figure 8. The structures and the spectroscopic response to Ca2+ ion binding in fluorescence probes FURA 2 and INDO-1. Both probes employ BAPTA recognition site and an appended fluorophore oriented by electron-donor part to ion binding site. For FURA-2, the strong λ-ratiometric response is observed in excitation spectra, whereas the emission spectra are unchanged. For INDO 1, the two-band ratiometry is seen also in fluorescence emission spectra.
Download figure:
Standard image High-resolution imageWith the emission spectra, the situation is more interesting. Only one band of Ca2+ -free form is seen for FURA-2 because the ion dissociates in the excited state. This is due to the reduction on excitation of the electron density of the nitrogen atom conjugated with the electron-withdrawing group of the fluorophore. This causes disruption of the interaction between this nitrogen and bound cation. Consequently, fluorescence emission closely resembles that of the free probe. That is why, the ratio F(λex 1)/F(λex 2) of intensities at two band in excitation spectra is used here. In contrast to FURA-2, in INDO-1 the excited-state charge transfer is insufficient to cause the nitrogen–Ca2+ bond breaking and, therefore, we observe the λ-ratiometric response in fluorescence. Detailed analysis of this mechanism can be found in [65].
In line with Ca2+ ion, the Zn2+ ions are very important in biology. Presented example of Zn2+ probe, P-Zn (figure 9), allows observing the distribution of these ions in living cells and tissues by comparing the colors of fluorescence emission [66]. Its operation is based on ICT mechanism. The initial emission peak of the present probe at 465 nm decreased with a new peak increased at 550 nm, leading to the ratiometric determination of Zn2+ with high accuracy. The two-photon microscopy allowed obtaining the zinc ion distribution in living tissues.
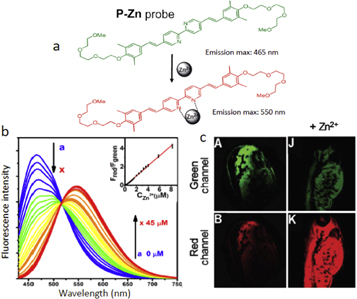
Figure 9. The two-band ratiometric probe based on ICT response for two-photon excited Zn2+ sensing and imaging in living systems [66]. (a) A proposed mechanism for sensing Zn2+ by probe P-Zn. Upon ion binding, fluorescence color changes from green (max. 465 nm) to red (max. 550 nm). (b) Zn2+-induced concentration-dependent fluorescence changes of P-Zn (Ex: 405 nm). Normalized one-photon (ex: 405 nm) fluorescence emission of 5 μM P-Zn probe with the addition of Zn2+ from 0 to 45 μM; Inset: the emission ratio Fred/Fgreen (Fgreen: 460–495 nm, Fred: 495–585 nm) obtained from P-Zn probe as a function of Zn2+ concentrations from 0 to 8 μM. (c) Detection of Zn2+ in zebrafish by obtaining images in green and red channels without and with the addition of Zn2+ ions by applying two-photon excitation at 800 nm.
Download figure:
Standard image High-resolution imageRegarding sensing the anions, the λ-ratiometric approach is highly popular, but most of developed techniques explore the concept of chemodosimetry (see section 2 of Part I [1]). The reason is that a strong hydration or large size of some anions does not allow strong electrostatic effects and easy generation of reporter signal based on electron, charge or proton transfer. Those are the sensors for F− [67] and CN- ions [68]. Providing the change in the dye structure, they induce the appearance of new fluorescence bands.
3.2. Signaling molecules in living cells
For analyzing and visualizing various types of biological processes, it is important to detect gaseous signaling molecules carbon monoxide (CO), nitric oxide (NO), and hydrogen sulfide (H2S). They are neutral molecules of very small size, and it is hard to realize here multiple weak interactions for applying the molecular recognition principle. Luckily, they are highly reactive species, and their high and specific chemical reactivity can be in the background of their detection. Thus, the principle of chemodosimetry was found to be the most efficient [69, 70]. Based on this principle, numerous fluorescent probes have been constructed for their analysis [71, 72].
For the λ-ratiometric detection of CO, the probe was synthesized based on attachment of a CO-specific carbamate derivative to the amino unit of naphthalimide [73]. In this case, ICT is restricted and the emission wavelength is blue-shifted, located at 472 nm (figure 10). When CO was added, the allyl acetate group was eliminated and amino-naphthalimide was released. The ICT process was restored and the emission wavelength was red-shifted to 545 nm. This probe system shows excellent sensing properties for CO, including rapid response, high selectivity and sensitivity in aqueous solution under mild conditions.
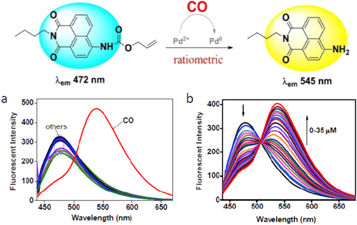
Figure 10. Chemodosimeter for fluorescent λ-ratiometric detection of CO based on Pd2+-assisted structural change [73]. (a) The fluorescence spectra showing the selectivity of CO sensor over many other related compounds (reactive forms of sulfur and oxygen, acids, etc). (b) The spectroscopic transformations occurring on titration with CO concentrations in the range 0–0.35 μM.
Download figure:
Standard image High-resolution imageFor imaging of CO in mitochondria, a ratiometric fluorescent probe was developed, in which the mitochondria-targeting unit (triphenylphosphonium moiety) and CO-responsive unit (allyl ether moiety) were covalently linking into the single molecule [74]. Treating with CO resulted in the cleavage of allyl ether element, leading to the new band in emission that allows λ-ratiometric measurements.
An interesting idea of coupling chemodosimetry with ESIPT was realized in ratiometric fluorescence probe for NO [75]. Initially, the probe (figure 11) exhibited a fluorescence emission peak at 470 nm, and interaction with NO initiated the ESIPT process leading to the formation of a new band at longer wavelengths. This spectral transformation can be plotted as a ratiometric change in fluorescence intensity (F560/F470) as a function of NO concentration.

Figure 11. The dye performing the excited-state intramolecular proton transfer (ESIPT) transformation after the reaction with NO [75]. Fluorescence spectra of probe (10 μM) upon the addition of DEA·NONOate probe (0–60 μM) in PBS buffer (1.0 mM, pH = 7.4). Inset: Changes in the fluorescence intensity ratio, F560/F470, in response to increasing concentrations of DEA·NONOate (0–40 μM). The spectra were recorded after incubation with different concentrations of nitric oxide for 30 min λex = 420 nm.
Download figure:
Standard image High-resolution imageProviding fluorescence sensing of H2S in different cell compartments, one has to account that its pKa value is 7.05 (at 25 °C), so that the ratio of its natural and proton-dissociated (HS-) forms may differ. The chemodosimeter approach may operate providing switching between the ground-state forms generating the change in excitation spectra as well as in fluorescence emission spectra [76]. Efficiency of this approach based on modulation of ICT reaction [77] is demonstrated in figure 12. The ratiometric detection in fluorescence can be based on a large red shift, over 62 nm. A dramatic change of color of both absorbed and emitted light can be detected visually.

Figure 12. The two-photon excited ratiometric fluorescence probes AcSH for sensing hydrogen sulfide [77]. The reaction scheme above shows how the H2S sensing is coupled with fragment-splitting and ICT reaction. (a) Time-dependent UV/vis absorption and (b) fluorescence spectra of 10 μm AcHS-1 probe in EtOH/PBS (v/v1:4, pH 7.0) response toward Na2S (1 mM), respectively, excitation at 410 nm. Insets in (a) and (b): photograph for the solution color and the fluorescent changes of AcHS-1 without and with Na2S in the buffer solution, respectively.
Download figure:
Standard image High-resolution imageThere were many other probes for hydrogen sulfide imaging in vivo, and the most efficient of them are based on λ-ratiometric principle. Typically, the ability of H2S to reduce the probe azide group to an amino group was explored. The electron-withdrawing group becomes converted into an electron donor group, which leads to the spectral shift [78]. The pyrene-containing probes responding by H2S-induced monomer-excimer transition were also suggested [79]. The λ-ratiometric probes for H2S detection become available for the near-IR region [80].
3.3. Metabolites of value for clinical diagnostics
Rapid and simple blood glucose monitoring is very important for diabetes patients. Here fluorescence sensing is competing with the self-test glucose measurement systems based on redox-couple-mediated enzymatic oxidation of glucose with electrochemical detection. To win this competition, the methods that allow visual detection of changes in emission color have to be developed.
The glucose binding power of boronic acid has been explored for a long time. The ratiometric signal of excimer formation was obtained on binding to glucose of two boronic-modified pyrene derivatives [81]. There were many other suggestions to use coupling of color-switching dyes with boronic acid [82]. Color change due to a dual-emission response to H2O2 generation coupled with enzymatic glucose oxidation was realized in nanostructures [83, 84]. Among recent developments are the dual red-green emission-switching nanocomposites based on quantum dots that allow visualizing glucose content with a naked eye [85].
The skill of researcher in generating new emission bands was demonstrated in sensing phosphate anions. It was shown [86] that the conformational change occurring on PPi binding generates the ESIPT reaction resulting in strongly shifted (by ~100 nm) fluorescence band (figure 13).
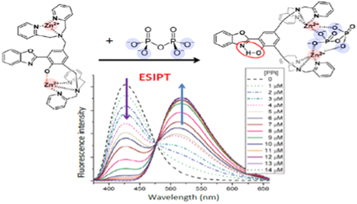
Figure 13. Fluorescence sensor for pyrophosphate based on generation of new fluorescence band due to activation of excited-state intramolecular proton transfer (ESIPT) reaction in 2-(2-hydroxyphenyl)-1,3-benzoxazole (HBO) fluorophore [86]. The sensor molecule coordinates two Zn2+ ions that change their interactions on PPi binding, making ESIPT possible. The sensor responds by the changes in distribution of fluorescence emission between two bands that allows wavelength-ratiometric recording.
Download figure:
Standard image High-resolution imageRecognition and sensing of nucleotides, and of ATP or GTP in particular, is an active area of research. The fluorescence probes are targeted to two recognition sites, the purine bases and triphosphate groups. Here the π-π stacking interactions together with H-bonding and steric effects can be very efficient. In this respect, a λ-ratiometric ATP sensor based on disruption of pyrene excimer is a classical example [87]. The, imidazolium receptors bearing two pyrene groups allow sensing ATP molecules that are sandwiched between two pyrene groups breaking the formation of excimer. Such sensor displays a unique selectivity for ATP over other nucleoside triphosphates. [88] demonstrates another possibility of realizing this idea, by using the cyclophanes.
Intracellular thiols, such as cysteine (Cys), homocysteine (Hcy) and glutathione (GSH), play key roles in biological systems. They regulate oxidation/reduction potential in cells and serve as potent antioxidants, but in many respects their function vary; therefore their differential detection is needed [89]. They may form different ground-state species producing different intramolecular charge transfer (ICT) effects and generating interplay between two bands in excitation spectra [90, 91]. Manipulating with the targeted chemical transformation in π-conjugation length of the probe based on fluorescein and coumarin platforms, the dual-mode and λ-ratiometric response to Cys over Hcy/GSH was achieved [92]. In another Cys probe, shrinking such conjugation resulted in dramatic shifts of excitation and emission spectra to shorter wavelengths [90].
Coupling chemodosimetry with the excited-state reaction (ICT, ESIPT, EET) allowed producing in sensing thiols the ratiometric response in fluorescence spectra only. An example of λ-ratiometric fluorescent probe based on ESIPT reaction designed for the detection of Cys is presented in figure 14. The probe BTP-Cys uses the acrylates moiety as a recognition site. This site also serves as the protection unit preventing the ESIPT reaction; this reaction is activated on bond splitting. In the absence of Cys, the emission is blue. After splitting and following ESIPT, a very large (113 nm) shift to green is observed [93]. The change in F523/F410 ratio of intensities fits nicely the desired range of Cys concentrations.

Figure 14. The probe for cysteine generating the two-band ratiometric response based on the excited-state intramolecular proton transfer (ESIPT) reaction [93]. (a) Proposed mechanism of response to Cys of probe BTP-Cys. (b) Fluorescence spectra in the absence or presence of Cys (0–400 μM). Inset: fluorescence intensity ratio (F523/F410) changes of BTP-Cys (1 μM) with the amount of Cys, and the fluorescence color change of this probe before and after addition of Cys under a 365 nm UV lamp.
Download figure:
Standard image High-resolution imageIn sensing glutathione, the excitation energy transfer (EET) between two fragments of the sensor molecule (rhodamine derivatives) is used [94]. The reaction with analyte destroys the light absorbance of EET acceptor, and the donor starts emitting light itself, providing good possibilities for λ-ratiometric analyte detection.
Fluorescence methods for the detection of cholesterol are generally based on the detection of hydrogen peroxide (H2O2) that appears as a result of its transformation in enzyme reaction with cholesterol oxidase (ChOX). A variety of these methods were based on construction of nanocomposites with λ-ratiometric response that include immobilized ChOX with the fluorescence-responsive and reference factors [95, 96]. Non-enzymatic λ-ratiometric determination of cholesterol can be based on its functional role to modify the structure and dynamics of biological membranes. The model system involving the liposomes with incorporated ratiometric fluorescent dye was suggested [97], and as a method for the determination of cholesterol it deserves further development.
Figure 15 demonstrates this possibility to use functional nanostructures together with probing fluorophore to sense the biologically important molecules such as cholesterol. Since the natural function of cholesterol is its participation in formation of biological membranes and providing its dynamic ordering, the modulation of this ordering in a model of small vesicles (liposomes) may provide the direct λ-ratiometric analytical response of the dye demonstrating ESIPT reaction [97]. Other attempts in this direction included the formation of Langmuir-Blodgett sensor surfaces formed of phospholipids [98].

Figure 15. The active role of phospholipid membrane in ratiometric cholesterol sensing. (a) The structure of cholesterol and the mode of its incorporation into phospholipid bilayer. It changes dramatically the structure and dynamics in bilayers formed of sphyngomielin (SM). (b) Molecular hybrid of steroid with fluorescence reporter demonstrating the ESIPT reaction that transforms SM vesicles into ratiometric cholesterol sensor [97]. The arrow demonstrates dramatic effect on spectra of cholesterol incorporation into SM vesicles and the absence of any effect on DOPC vesicles, in which cholesterol does not provide strong perturbation of structure.
Download figure:
Standard image High-resolution imageDetermination of hydrogen peroxide H2O2 is of its own value as an indicator of oxidative stress, and its role can be extended as an output mediator in the essays of different metabolites being the product of their oxidation by correspondent enzymes. One of these reactions catalyzed by enzyme uricase was used for the determination of uric acid [99, 100]. Selective quenching of fluorescence in designed nanocomposites provides λ-ratiometric signal. The coupling of hydrogen peroxide detection with ESIPT reaction allows making the fluorescence probe for λ-ratiometric imaging in mitochondria [101]. Based on these ideas, many other organelle-targetable probes for hydrogen peroxide have been synthesized. They are based on chemical transformation starting the excited-state process. New fluorescence bands are generated for providing efficient λ-ratiometric detection and color-changing in imaging [102–104].
The rapid, sensitive and selective detection of free bilirubin in water and urine was achieved with hybrid ratiometric fluorescence sensor composed of Rhodamine B and polymer nanoscale aggregate composing a FRET pair [105]. A blue (465 nm) to orange (577 nm) fluorescence color change is used in this fluorescence assay.
3.4. Clinically important enzymes and disease biomarkers
Rapid, simple, accurate and highly sensitive detection of enzymes is essential for early screening and clinical diagnosis of many diseases. Fluorescence spectroscopy, microscopy and flow cytometry with λ-ratiometric recording satisfies these requirements in optimal way.
For the detection of alkaline phosphatase (ALP), a ratiometric fluorescent probe FCP was designed based on the hydroxyl electron-donating group in fluorescein-coumarin conjugate protected by the phosphate group [106]. The splitting by ALP of phosphate group resulted in the change of emission color from blue to green (figure 16).

Figure 16. Fluorescence probe for alkaline phosphatase (ALP) based on cleavage of phosphoryl ester groups in fluorescein-coumarin coupled dye (FCP). ALP causes decrease of FCP emission at 465 nm and increase of reaction product FC at 530 nm, generating ratiometric signal for providing cell imaging, detecting the changed colors [106].
Download figure:
Standard image High-resolution imageThe ALP-produced removal of phosphate protection of the electron-donating group was also used in other assays. In hemicyanine dye, it allowed for the λ-ratiometric determination of ALP in the near-IR region, at 590 and 670 nm [107]. The suppression in FRET reaction from blue-emitting carbon dots to the formed by ALP activity yellow fluorescent energy acceptor 2,3-diaminophenazine (DPA) generated a powerful λ-ratiometric signal [108].
A dual-emission fluorescent nanoscale probe for acetylcholine esterase was reported [109]. The probe showing a fast emission color change (620 to 662 nm) in response to β-galactosidase activity was also developed and applied for fluorescence microscopy and flow cytometry [110]. The drug-metabolizing enzyme cytochrome P450 1A was visualized with a two-photon fluorescent probe based on 1,8-naphthalimide that provided changing the emission color from 452 to 564 nm [111]. The λ-ratiometric probes targeting other enzymes were developed [112] with particular emphasis on fluorescence response in the near-IR region [113].
3.5. Pathological protein aggregates
The appearance of neurodegenerative diseases is related with the formation of abnormal protein aggregates. The λ-ratiometric probes have started to play important role in targeted recognition of these aggregates and in studying the conditions for their appearance. They were suggested for the aggregate labeling, inhibiting their assembly, and studying the possibility to reduce their cytotoxicity [114, 115].
Because the understanding of amyloid fibrillation in molecular detail is essential for the development of strategies to control this process, it becomes natural to search for fluorophores that can be the most efficient in these studies. Those are the dyes of 3-hydroychromone (3HC) family that provide multiparametric spectral response to polarity and hydration of their environment [116, 117], see section 5.3 of Pt. I [1]. The two-band deconvolution of their excitation spectra and three-band deconvolution of emission spectra [118] allowed obtaining simultaneously the information on the changes in polarity and hydration of probes attached to aggregating molecules. The α-synuclein, that exhibits pathogenic folding leading to Parkinson disease, and a number of its mutated forms were in focus of these studies [119], figure 17.

Figure 17. The structure of α-synuclein and of its disease-related mutants and the multiparametric response of the bound fluorescent dye [119]. (a) The presentation of α-synuclein structure, in which the charged and Pro residues are marked with different colors. Three structural regions are indicated. Three point mutations (A30P, E46K, A53T) are found in patients suffering from early onset of Parkinson's disease and their positions are marked with arrows. (b) The 3D representation and contour plots of correlated excitation-emission spectra of 3-hydroxychromone probe 4-(diethylamino)-3-hydroxyflavone showing the difference between these mutants. (c) Deconvolution of fluorescence spectra into three individual components, N*, H-N* and T*. (d) The ratio of these individual components characterizing polarity (N*/T*) and hydration (H-N*/N*) of the probe environment. Ratios of the integrated areas of the N* and T* bands (violet bars) and of the H-N* and N* bands (orange bars).
Download figure:
Standard image High-resolution imageCharacterizing simultaneously the polarity and hydration (proticity) of probe environment by observing the interplay of N*, T* and H-N* contributions to 3HC probe emission, it became possible to distinguish between polymorph forms derived from naturally occurring point mutations in α-synuclein structure ([119]. The sensitivity of such a simple external probe to conformational alterations induced by point mutations is unprecedented and provides new insight into key phenomena in the formed amyloid fibrils: plasticity, polymorphism, propagation of structural features, and structure-function relationships underlying toxicity. Moreover, the results of monitoring the kinetics of aggregation of α-synuclein, allowed providing the information on early and intermediate stages of the overall reaction [120]. The unexpected result was that the reaction intermediates differ significantly not only from monomeric but also from fibrillar amyloid forms of α-synuclein.
3.6. Hazardous organic compounds
Nitroaromatic compounds that are extensively used in different industries pose a serious pollution threat. They can be detected applying benzimidazole-based D-π-A fluorophores with λ-ratiometric response [121]. Moreover, these dangerous compounds are explosive, and their discriminative detection in trace amounts has to be provided. This can be done in ratiometric way with blue emissive carbon dots in combination with yellow and red emissive CdTe quantum dots [122]. The sensor array demonstrates a promising capacity to detect structurally similar nitroaromatics in mixtures and complex media of soil and groundwater samples.
Phosgene is a highly toxic gas that is a serious threat to human health and public safety. A novel fluorescent probe for phosgene detection based on ESIPT reaction in quinolone fluorophore was suggested [123]. The amidation reaction between phosgene and quinolone suppresses effectively the ESIPT process in the probe, providing rapid change of emission color (red to green).
Thiophenol belongs to a class of highly reactive and toxic aromatic thiols with widespread applications in the chemical industry for preparing pesticides, polymers, and pharmaceuticals. For its ratiometric detection, a chlorinated BODIPY-based fluorescent probe was reported [124]. The ratio of their fluorescence intensities at 581 and 540 nm could remarkably increase (up to 640-fold) in the presence of excess amount of thiophenol. For its detection, a FRET-ICT-based ratiometric fluorescent and colorimetric probe was also developed [125]. With broad spacing of two emission peaks (133 nm) upon thiophenol addition, the latter probe exhibits drastic (over 2100-fold!) enhancement of the fluorescence intensity ratio.
Hazardous food contaminants require rapid methods for their detection [22]. Quantitative determination of hazardous synthetic colorants in food was achieved with green/red dual emissive carbon dots as the probes [126]. Antibiotics with their great contributions to the improvement of human health become dangerous if they are found in food and water; there are many λ-ratiometric methods developed for their detection [127–129]
Pesticide residues have seriously threatened human health and affected the sustainable development of the environment. Some of them show their own ability to absorb and emit light that can be used in sensing [130]. An interesting example of using the reporting abilities of excimer-monomer transition of pyrene derivatives incorporated into nanocomposites based on cyclodextrin [131] is presented in figure 18.

Figure 18. Discriminative and selective λ-ratiometric detection of primicarb pesticide (PC) based on excimer-monomer transition in nanocomposites [131]. (a) Synthesis of a pyrene-appended β-cyclodextrin probe. (b) The detection principle. The analyte disrupts the electronic interactions between pyrene monomers resulting in excimer-monomer switching. (c) The changes in fluorescence intensity of pyrene-appended β-cyclodextrin with the addition of increasing concentrations of pirimicarb.
Download figure:
Standard image High-resolution image3.7. Nucleic acids
The ratiometric fluorescence probes are attractive for the nucleic acids research, particularly for their in situ real-time tracking in living cells and tissue sections and in the studies of their dynamics-function relationships. It was demonstrated that the D–π–A–π–D-type ICT probe was able to respond to dynamic behavior of nucleic acids during different cellular processes in real time, such as the aggregation and separation of chromatin in apoptotic cells [132].
Fluorescent amino acids (such as 3-hydroxychromone derivatives) when incorporated into specific peptides can be used to study the interactions of their zinc-finger sites with nucleic acids [133]. Their dual emission resulting from ESIPT reaction indicates such highly selective binding (figure 19).
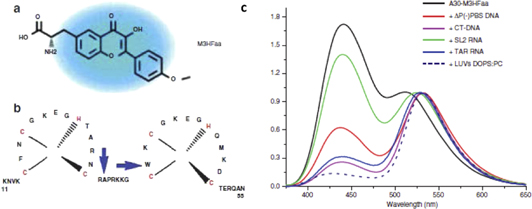
Figure 19. Environment-sensitive fluorescent color-switching amino acid M3HFaa incorporated into zinc-finger peptide provides different λ-ratiometric response to binding with different nucleic acid structures [133]. (a) The M3HFaa structure. (b) Sequence of the nucleocapsid peptide NC(11–55), where the arrows show two positions of natural amino acids (A30 and W37) replaced by M3HFaa. (c) Effect of different oligonucleotide sequences and phospholipid vesicles (LUVs DOPS:PC) on the normalized fluorescence spectra of the labeled NC(11–55) peptide (A30-M3HFaa). Excitation wavelength 360 nm.
Download figure:
Standard image High-resolution imageThe development of ratiometric emissive nucleoside analogues have stimulated the studies of nucleic acids [134, 135]. They found applications in probing the local structure and dynamics of nucleic acids, typing single-nucleotide polymorphism (SNP), investigations of DNA-proteins interactions, etc Prospective candidates for this role are 3-hydroxychromones due to extreme sensitivity of their ESIPT reaction to local environment and their small size compatible with that of a base pair, ~10 Å [136]. Featuring exceptional environmental sensitivity by switching between two well-resolved fluorescence bands, they can serve as highly responsive biosensors to site-specific probing of the proximal environment of nucleic acid structures [134, 137, 138]. Some of these results are presented in figure 20.
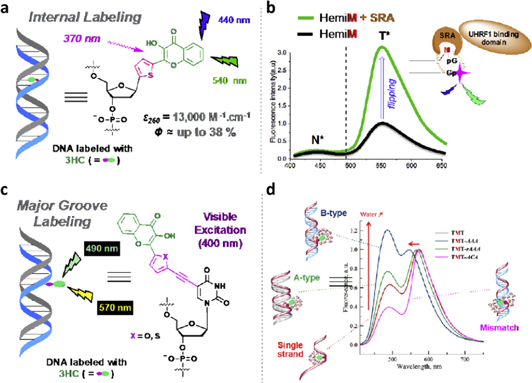
Figure 20. Creation and application of fluorescent DNA base analogs and labels based on 3-hydroxychromone (3HC) dyes [134]. (a) Internal DNA labeling, e.g. strategy based on the replacement of a nucleobase by a 3HC reporter. (b) Fluorescence spectra displaying the selective flipping of 5mC (M) by the SRA domain of the UHRF1 chaperone protein. (c) External DNA labeling, e.g. modification of a uracil base to site specifically incorporating a 3HC reporter in the hydrated major groove. (d) Application of hydration probing to detect DNA conformational changes and mismatches.
Download figure:
Standard image High-resolution imageMany other applications are outside this Review because of its limited space and inability to cover all of them by a single author. Among them are the λ-ratiometric sensors for viscosity [139], temperature [140] and pressure [141] on a molecular scale. Detection of pathogenic bacteria [142], checking their drug resistance [143] and identifying the spores [144] benefit from using ratiometric fluorescence sensing. Viruses, including SARS-CoV-2, can be detected by λ-ratiometric visualization [145] or by two-color immunoassays [146].
4. Multicolor and λ-ratiometric imaging
Seeing is believing, as the saying goes. However, the imaging based on a single-wavelength intensity of a targeted probe provides little grounds for that. It is always influenced by target concentration-independent experimental or physiological factors that can cause nonspecific and misleading images. It is difficult to identify and correct them in order to accurately quantify the true concentration of target analytes. In this respect, imaging in two colors offers important advantages [147]. The λ-ratiometry allows achieving extreme sensitivity and correction for interfering factors, even at low level of absolute intensities [148, 149].
The λ-ratiometry is fully compatible with major techniques used in microscopy—the two-photon imaging [150, 151] and confocal imaging [152] with near-IR excitation. This allows efficient application of properly designed upconversion nanomaterials.
In live cell and tissue imaging, as well as in the studies of any heterogeneous system, the problem always stands on the distribution of probe itself and in what concentration it targets the necessary site or organelle. Therefore, the λ-ratiometric imaging can be combined with the imaging based on absolute intensity of emitted light that is proportional to fluorescent probe concentration. It can be the image formed in one of the color channels, so that the two images can be analyzed together.
The problem of poor resolution of λ-ratiometric images can arise when the spectral separation between the emission bands is insufficient, and their 'cross-talk' leads to color mixing and to low-contrast resolution performance. Its solution is in applying the probes with largest spectral separation between the emission bands [153].
Illustrative are the applications of λ-ratiometric imaging to visualize the cell membrane structures and dynamics that can be indicators of many physiological and pathological processes. Thus, the λ-ratiometric cell microscopy have proved to be very efficient for characterizing the early steps of apoptosis [154, 155] and eryptosis [156]. The dyes of 3-hydroxychromone family that can generate switchable three bands in fluorescence emission (see also figure 17) were adapted for incorporation into outer leaflet of cell membranes. The changes of their emission occurring on apoptosis reflect the changes in these membranes in terms of polarity and hydration at their location [157]. Figure 21 illustrates the modifications of spectra observed in one of these dyes (F2N12S) on apoptosis in comparison with their responses on cholesterol depletion and with their spectra in model phospholipid bilayers. The λ-ratiometric images demonstrate dramatic change of illuminated membranes on apoptosis.
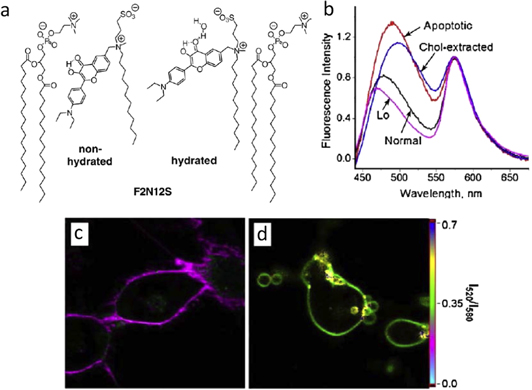
Figure 21. Monitoring the apoptosis with F2N12S probe incorporated into outer leaflet of cell membrane [157]. (a) Probe F2N12S and its two expected forms in lipid bilayers (schematically presented as a monolayer): non-hydrated and hydrated (water-bound). (b) Fluorescence spectra of F2N12S probe in live and apoptotic cells, compared to the spectra of the probe in Lo phase of the lipid membrane and to that in cells after cholesterol extraction. Fluorescence ratiometric images of intact (c) and apoptotic (d) cells stained with F2N12S and presented on I520/I580 ratiometric scale.
Download figure:
Standard image High-resolution imageMolecular dynamics in living cells and tissues is commonly described in terms of 'microviscosity' sensed by fluorescence probes exhibiting their rotation or the rotation of their segments in viscous media. Ratiometric detection of their emission is difficult to perform because the wavelength-shifted twisted state of the rotors is typically strongly quenched, and this quenching depends on polarity of their local environment. Therefore, the dye dimers coupling viscosity-sensitive and insensitive fluorophores have been employed for λ-ratiometric sensing of viscosity in living systems [158, 159].
A new principle of visualizing the distribution of microscopic dynamics within living cells and tissues with the construction of λ-ratiometric images was suggested recently [160]. A family of DPAC dyes in the ground state reveal a saddle-like structure distorted along the lines connecting two N atoms. In the excited state, instead of twisting, they demonstrate a rare case of bent-to-planar motions operating in a way reminiscent of a butterfly opening its wings. The bent-to-planar motion leads to elongation of the π-delocalization, resulting in dependent on molecular dynamics but polarity-insensitive strong spectral shift, from blue to red. Interplay between these well-separated blue and red bands in emission spectra allows constructing the exceptionally contrasted images of cellular dynamics (figure 22). Moreover, the application of probes with increased affinity towards biological membranes (such as DPAC-OH) allowed detecting the differences in dynamics between plasma membrane and the intracellular membrane structures. The uniquely performed λ-ratiometric microviscosity imaging was extended for mapping the living tissues and observing their inflammation-dependent changes.

Figure 22. A new principle of visualizing the distribution of microscopic dynamics within living cells and tissues based on butterfly-like bent-to-planar motion in the excited states of DPAC dyes [160]. (a) The structures of parent DPAC dye and the probe DPAC-OH designed for λ-ratiometric sensing of cell membranes. Below: the fluorescence spectra of DPAC-OH in the media of different viscosities (in methanol-glycerol solvent mixtures). (b) Two-photon excited fluorescence images of HeLa cells labeled with DPAC-OH. (c) Emission spectra collected at specific areas marked by arrowed points in (b). Magnification of these sites are also presented at the right side. Below: calculated Blue/Red intensity ratios plotted on a viscosity scale, demonstrating dramatic differences of molecular dynamics in cell interior; sER: Smooth endoplasmic reticulum; rER: rough endoplasmic reticular; Nm: nuclear membrane; LD: lipid droplet.
Download figure:
Standard image High-resolution image
Based on restricting-releasing the molecular wing's motions leading to switching between blue and red emissions of DPAC dyes, is it possible to construct the sensors for molecular analytes? Such possibility may exist. It was shown that covalent linking of two wings by a dialkoxybenzene-alkyl-ester or -ether linkage with different chain lengths in DPAC provides restriction for its segmental motions that depends on the length of link [161]. What remains is to make these links cleavable in specific chemical or enzyme reaction.
The λ-ratiometric detection in vivo is the broad prospective field of application for fluorescent nanoparticles, such as carbon dots [162] and nanocomposites formed on their basis [163, 164]. This allows obtaining the intracellular analyte distributions using the full power of multicolor imaging. Ratiometric fluorescence imaging of tissues opens new prospects in diagnosis of cancer and of localizing tumors during surgery [165]. Strong efforts are observed towards shifting the λ-ratiometric reporting signal to near-IR range for deeper light penetration into tissues [166–168].
5. Conclusions and prospects
The multicolor ratiometric reporting is remarkable in combining high information content with simplicity of performance. In sensing and imaging, it allows overcoming two important obstacles complicating the broad-scale application of fluorescence: (a) fluorescence intensity has only relative meaning and needs calibration and (b) high absolute sensitivity is also the sensitivity to different target-independent interfering factors. Addressing these issues, the λ-ratiometry suggests simple but very efficient solution by providing two or more channels of recording the analytical information. Essential progress is observed in the development of λ-ratiometry from a research tool into a general strategy with innumerable areas of applications.
This strategy involves targeted design and synthesis of fluorescence reporters, the choice of mechanism of their response and of the mechanism coupling this response with the target-binding event. Its realization comes through optimizing the sensor-target interaction satisfying the requests of λ-ratiometry. The dual or triple fluorescence output is generated on this interaction directly, either by molecular reactivity or by molecular recognition.
The choice of materials to realize this function is tremendous and requires optimal selection. There are small organic molecules changing the color of their fluorescence in the ground-state or in excited-state reaction and also the nanoscale structures performing as coupled or uncoupled dual-triple emitters. Numerous examples from the literature, the small part of which was discussed above, allow stating that the benefits of such strategy are great but they are still not realized in full.
Expanding the possibilities of λ-ratiometry, we must think not only on higher brightness of reporting materials but also on richer change of their colors, increasing the spectral resolution. Their sharper emission peaks should suppress the 'cross-talks' within the dye pairs. Extension of wavelength scale to near-IR region offers additional possibilities for researchers.
In order to bring the λ-ratiometry to the line of most prospective methods for common use, we need to offer more efficient and economically attractive sensor systems. Common spectroscopic and microscopic instrumentation can be easily applied for ratiometric detection of intensities at fixed wavelengths. Meantime, the most attractive devices addressing the public needs are the portable low-cost diagnostic tools exploiting λ-ratiometric design, which should make the procedure very simple, up to the naked-eye visual detection.
Employing the array-based strategy in the design of λ-ratiometric sensors can provide an attractive possibility for multi-analyte detection. Optical sensor arrays have proven to be versatile tools for simultaneous identification and discrimination of different classes of analytes offering convenient and fast point-of-care testing; therefore, it should be the trend for further developments. It is expected that owing to its outstanding capabilities, the array-based sensing strategy can be widely integrated with ratiometric fluorescent probes for multi-analyte sensing.
Explosive developments are expected in imaging of cells and tissues with multi-analyte multi-color readout based on the principles of λ-ratiometry. Coupled detection of several analytes and formation of images based on their distribution may become possible, overcoming current limitations and introducing logical operations with several inputs and several informative outputs, of course, in different colors. Thus, designing ratiometric fluorescent sensors for multiplexed biosensing and imaging is on the forefront of current research and development.
Data availability statement
The data that support the findings of this study are available upon reasonable request from the authors. The data that support the findings of this study are available upon reasonable request from the authors.
Recommended additional reading
Basic information on fluorescence providing the knowledge on response of its parameters to intermolecular interactions:
Jameson, David M. Introduction to fluorescence. Taylor & Francis, 2014.
Valeur, Bernard, and Mário Nuno Berberan-Santos. Molecular fluorescence: principles and applications. John Wiley and Sons, 2012.
Lakowicz, Joseph R. Principles of fluorescence spectroscopy. 3-d ed. Springer US, 2006.
Overview of materials and techniques applied in fluorescence sensing and of its broad area of applications
Demchenko, Alexander P. Introduction to fluorescence sensing. 3-d ed., V. 1. Materials and techniques. Springer-Nature, 2020
Demchenko, Alexander P. Introduction to fluorescence sensing. 3-d ed., V. 2. Target recognition and imaging. Springer-Nature, 2023
Funding
This research has received no external funding.
Conflicts of interest
The author declares no conflict of interest.