
Abstract
Postprandial insulin-stimulated glucose uptake into target tissue is crucial for the maintenance of normal blood glucose homeostasis. This step is rate-limited by the number of facilitative glucose transporters type 4 (GLUT4) present in the plasma membrane. Since insulin resistance and impaired GLUT4 translocation are associated with the development of metabolic disorders such as type 2 diabetes, this transporter has become an important target of antidiabetic drug research. The application of screening approaches that are based on the analysis of GLUT4 translocation to the plasma membrane to identify substances with insulinomimetic properties has gained global research interest in recent years. Here, we review methods that have been implemented to quantitate the translocation of GLUT4 to the plasma membrane. These methods can be broadly divided into two sections: microscopy-based technologies (e.g., immunoelectron, confocal or total internal reflection fluorescence microscopy) and biochemical and spectrometric approaches (e.g., membrane fractionation, photoaffinity labeling or flow cytometry). In this review, we discuss the most relevant approaches applied to GLUT4 thus far, highlighting the advantages and disadvantages of these approaches, and we provide a critical discussion and outlook into new methodological opportunities.
Export citation and abstract BibTeX RIS

Original content from this work may be used under the terms of the Creative Commons Attribution 4.0 licence. Any further distribution of this work must maintain attribution to the author(s) and the title of the work, journal citation and DOI.
1. Introduction
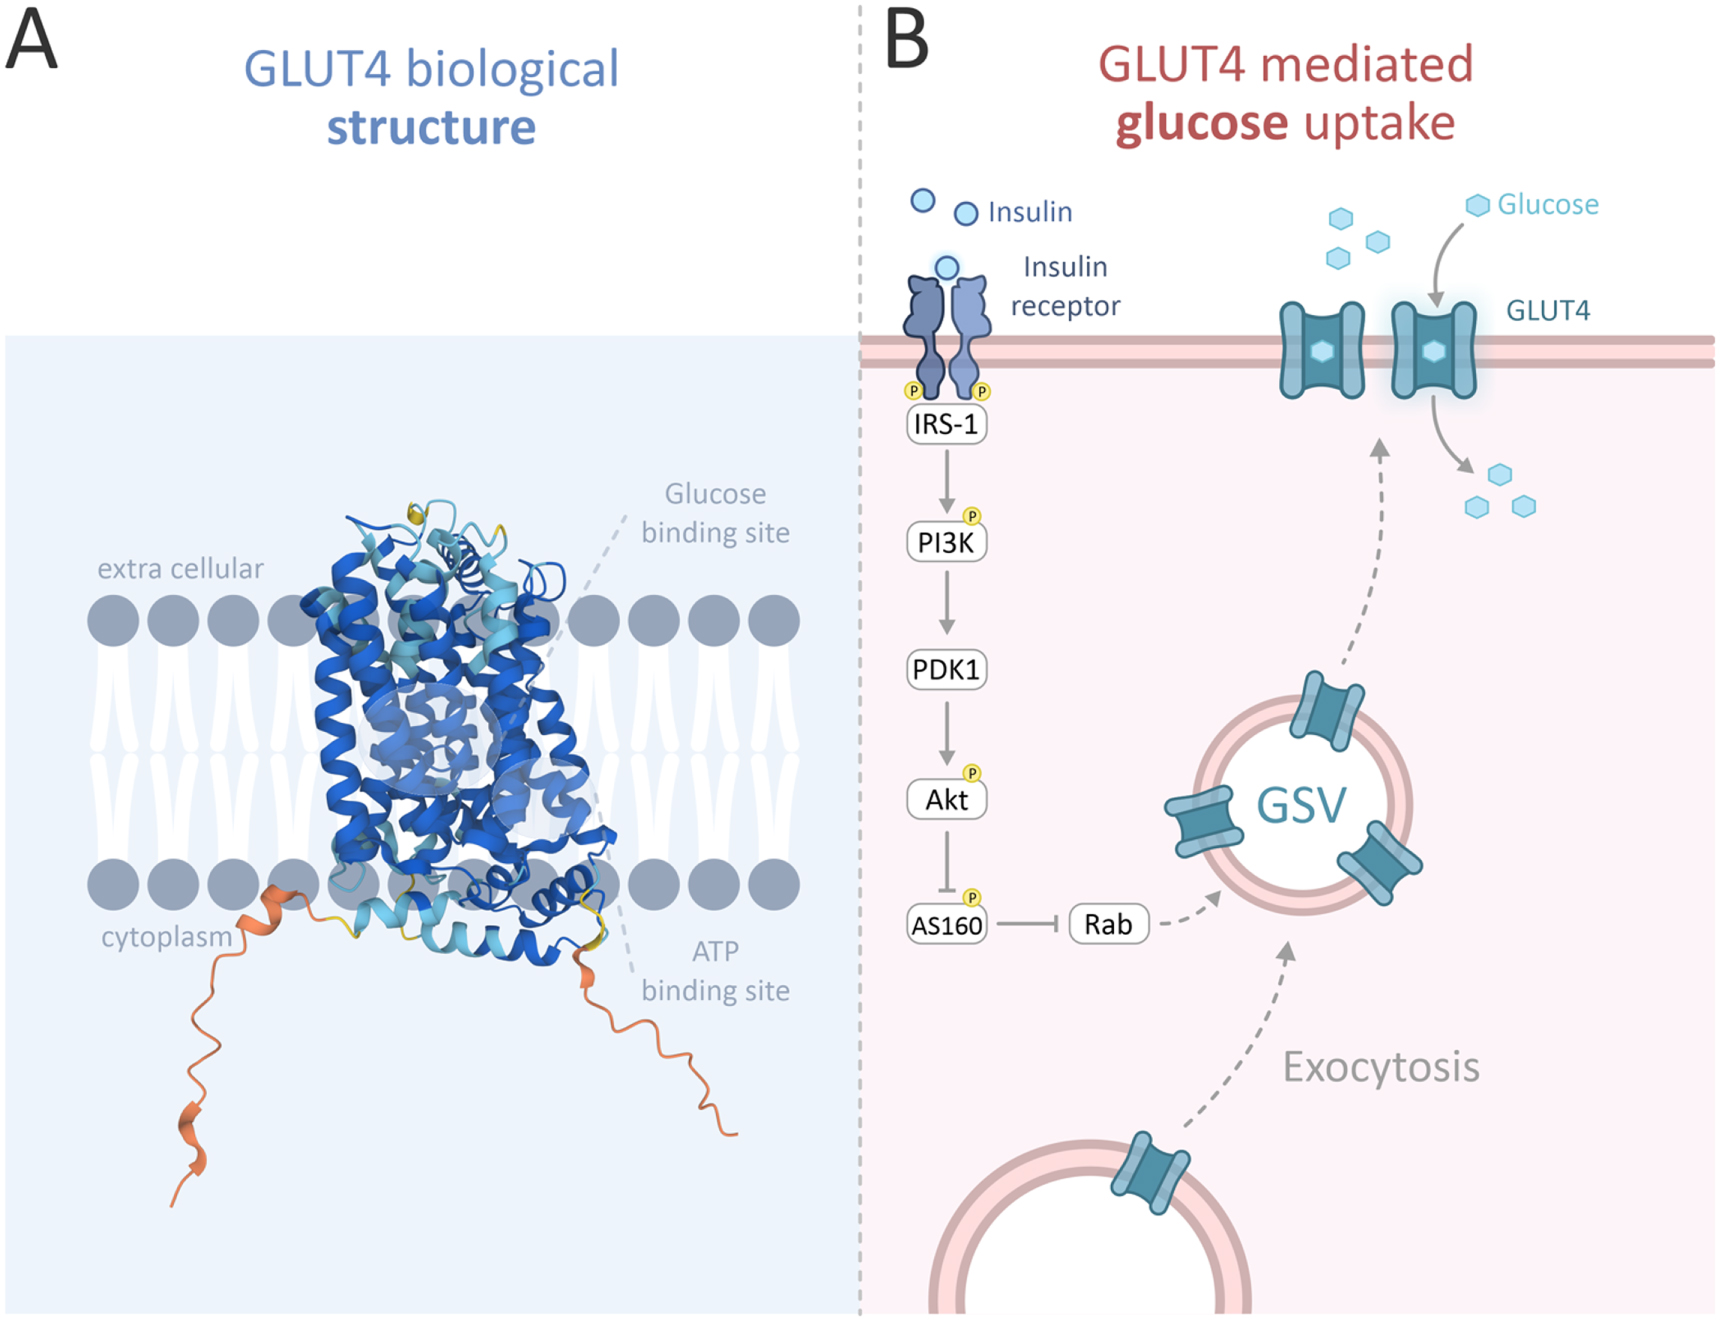
Blood glucose concentration is one of the most strictly regulated and carefully monitored physiological parameters in humans. To avert hyperglycemia and its pathophysiological effects, postprandial elevated blood glucose levels are rapidly diminished through glucose uptake into peripheral tissue [1]. This mechanism is primarily mediated by insulin-dependent glucose transporter type 4 (GLUT4), a member of the GLUT family that is predominantly expressed in muscle cells and adipocytes. All 14 transmembrane GLUT proteins [2] share basic structural components, including 12 transmembrane fragments, glucose and ATP binding sites and N and C termini located in the cytoplasm of the cell [3], as illustrated in figure 1. GLUT4 is a high-affinity glucose transporter and enables the facilitated diffusion of glucose along its concentration gradient into muscle and adipose cells in an insulin-dependent manner. Under basal conditions with low insulin levels, the majority of GLUT4 is packaged in intracellular membrane compartments called GLUT4 storage vesicles (GSVs), and only approximately 5% of the transporter is located at the cell surface. When insulin levels rise, GSVs translocate to the plasma membrane, tether, dock and fuse with the membrane through exocytosis. This translocation of GLUT4 to the plasma membrane in response to insulin results in a 10- to 30-fold increase in glucose uptake [2, 4, 5].

Figure 1. GLUT4 structure and function. The biological structure of GLUT4 (A) and the canonical insulin signal transduction pathway leading to GLUT4 translocation to the plasma membrane. Reproduced from UniProt: the universal protein knowledgebase in 2021; Nucleic Acids Res. 49:D1 (2021). CC BY 4.0. (B) [2, 6, 7–10]. Binding of insulin to the insulin receptor induces the recruitment and phosphorylation of insulin receptor substrate (IRS) proteins that bind with phosphoinositide 3-kinase (PI3K) and activate it. This promotes the activation of the protein kinase Akt through the phosphorylation action of pyruvate dehydrogenase lipoamide kinase isozyme 1 (PDK1). Active Akt stimulates GSV exocytosis by phosphorylating and thus inactivating GTPase-activating proteins (GAPs) such as Akt substrate 160 (AS160) which regulate the activity of small GTPases that are involved in GLUT4 vesicle translocation to the plasma membrane [1, 2]. Following the increase in surface GLUT4, glucose is rapidly transported into the cell [11].
Download figure:
Standard image High-resolution imageThe effect of insulin on promoting sufficient peripheral glucose uptake into muscle and adipose tissue is crucial to maintaining normal glucose homeostasis. Impaired insulin-induced GLUT4 translocation to the plasma membrane is considered one of the initial steps in the development of insulin resistance and consequently type 2 diabetes mellitus (T2DM), thus making insulin-induced GLUT4 translocation a popular target of antidiabetic drug research [2, 12]. The application of screening approaches that are based on the analysis of GLUT4 translocation to identify insulin-mimetic substances that can be utilized to improve glucose clearance, reduce blood glucose or increase insulin sensitivity is currently of great interest [13]. Earlier biochemical methods to detect GLUT4 translocation to the plasma membrane included techniques such as subcellular fractionation followed by Western blot analysis or cytochalasin B binding assays [14–16], photoaffinity labeling followed by immunoprecipitation [17, 18], flow cytometry [19, 20] and enzyme-linked immunosorbent assay (ELISA)-guided binding analyses [21, 22]. Each of these methods has its own advantages and limitations, but most of them include more than one step and are therefore prone to error propagation, and all of them suffer from a limit of resolution.
For example, membrane fractionation techniques hardly allow us to determine whether the transporter is fully incorporated into or just adjacent to the plasma membrane [23]. Assays based on cytochalasin B binding do not differentiate between the individual isoforms of the glucose transporter [24]; photoaffinity labeling with cell-impermeable probes enables the detection of cell surface glucose transporters but is not isoform specific [23]. A crucial advancement for cellular GLUT4 localization studies was the application of recombinant GLUT4 with an inserted myc or HA (human influenza hemagglutinin) epitope tag into the first exofacial loop of the transporter in conjunction with a genetically encoded fluorophore, primarily green-fluorescent protein (GFP), at the C-terminus, enabling the normalization of cell surface GLUT4 to total recombinant GLUT4 as well as visualization by live cell imaging [25–27]. However, this cell model also posed difficulties, as the majority of insulin-sensitive cells need to be differentiated and are hard to transfect. In 2010, a strong in vitro model for screening GLUT4 translocation modulators was introduced using Chinese hamster ovary cells (CHO-K1) stably expressing the human insulin receptor as well as myc- and GFP-tagged GLUT4 [28]. These cells do not require differentiation and exhibit a high level of GFP fluorescence, which may be attributed to the distinctive redox potential of the cell line, cytoplasmic pH and oxygen tension [25]. Direct visualization of GLUT4 translocation has been achieved by tracking the movement of GFP fluorescence to the plasma membrane using fluorescence microscopy techniques. Additionally, immunostaining of the myc epitope in the extracellular loop enables the detection of recombinant GLUT4 proteins correctly inserted into the plasma membrane by immunofluorescence detection [28]. Confocal microscopy is the most popular technique in this regard and has been used successfully to track recombinant GLUT4 translocation and characterize the impacts of insulin and insulin mimetics in this process [29, 30]. In addition to confocal microscopy, total internal reflection fluorescence (TIRF) microscopy has been widely applied as a highly sensitive method to analyze and identify key players in GLUT4 trafficking, such as several Rab proteins [31], as well as to screen potential insulin mimetics and antidiabetic substances [6, 32, 33]. A summary of the methods used for the analysis of GLUT4 trafficking is presented in table 1.
Table 1. Overview of the described methods for the quantitation of GLUT4 translocation in cells.
| Method | Live Cell Imaging | Throughput | Resolution | Recombinant Construct | Comments | References (PMID) |
|---|---|---|---|---|---|---|
| Biochemical Methods | Not possible | High throughput possible | Cell population (except flow cytometry: single cell) | Not needed | Several preparation steps needed, generally labor-intensive and time-consuming, comparably inexpensive | 6360220 8690151 10871204 31555030 23606883 |
| Immunoelectron Microscopy | Not possible | Low | Subcellular | Not needed | 10984434 11069765 8271273 2007617 | |
| Confocal Fluorescence Microscopy | Possible | Low (up to high at special setups) | Subcellular | Necessary | Subcellular location is possible with costaining | 33378945 25052490 33120934 19854150 |
| TIRF Microscopy | Possible | Low (up to high with a special setup) | Subcellular | Necessary | 25039620 33120934 29218524 17339344 | |
| Super-Resolution Microscopy | Possible | Very low | Subcellular | Necessary | Used to study GLUT4-dynamics in compartments | 23520472 27888215 32993061 28556933 32305516 |
2. Classic biochemical and spectroscopic approaches
2.1. Membrane fractionation
Subcellular fractionation techniques were widely used to study endogenous GLUT4 trafficking in earlier studies. This process dissects cells into their various organelles based on their density using high concentrations of sucrose. Intracellular GLUT4 compartments can be separated into purified plasma membrane fractions and low-density microsome fractions through differential or density gradient centrifugation processes. GLUT4 proteins in these fractions can be detected by Western blotting or cytochalasin B binding assays to examine the translocation of GLUT4 to the plasma membrane upon insulin stimulation [14–16, 34].
Western blots are frequently used today in combination with other techniques on GLUT4, often to confirm the results of new approaches. Both immunoblotting and cytochalasin B photoaffinity labeling have aided in identifying glucose transporters in various tissues and species [35–38].
A major limitation of fractionation studies is the inability to distinguish between GLUT4 proteins just adjacent to the plasma membrane and GLUT4 proteins that are fully incorporated into the plasma membrane and actively facilitate glucose transport. Moreover, with indirect methods such as cell homogenization and fractionation, compartmentalized trafficking or signaling events are unobservable. Furthermore, quantification of the results remains challenging, and such studies offer limited temporal resolution [23].
2.2. Photoaffinity labeling followed by immunoprecipitation
In contrast to membrane fractionation-mediated determination of insulin-induced GLUT4 translocation, affinity photolabeling techniques allow for the detection of cell surface glucose transporters. Thus, only transporters that are fully inserted into the plasma membrane and available to transport glucose are detected. This detection of cell surface glucose transporters has previously been achieved, for example, through the utilization of impermeant, exofacial bis-hexose probes as glucose transporter-specific photolabels. Following irradiation-induced cross-linking of the probe with cell surface glucose transporters, labeled proteins are isolated by immunoprecipitation or precipitation of biotinylated probes using streptavidin beads. Several subsequent biochemical techniques enable the detection of endogenous GLUT4 directly inserted into the plasma membrane [17, 18, 23, 39].
The disadvantages of photoaffinity labeling in this context may lie in the various biochemical steps required postlabeling, including membrane dissolution, gel electrophoresis and immunoblotting, to detect and quantitate the labeled GLUT4 isoform. Although photoaffinity labeling has advantages over membrane fractionation techniques, the efficacy of photoaffinity labeling strongly depends on the ability to acquire quantitative immunoprecipitation and recovery upon SDS-PAGE [23]. Furthermore, nonspecific cross-linking events can hinder photoaffinity labeling. To differentiate between specific cross-linking and background labeling, several control experiments must be applied [40].
2.3. Flow cytometric analysis
Flow cytometry is a multiparametric, laser-based technology that allows for quantitative analysis of the characteristics of single, living cells in solution. Cell surface proteins are easily accessible to antibodies. After antibody staining, the suspended cells are passed in a stream through a laser beam, and the emitted fluorescence and light scattering properties are processed by detectors. With fluorescence-activated cell sorting (FACS), a specialized type of flow cytometry, the populations of interest can also be isolated for subsequent analysis [41].
Flow cytometry has been used to quantify GLUT4 translocation to the plasma membrane by labeling with fluorochrome-conjugated antiGLUT4 antibodies directed to an external epitope of the transporter. In this way, only cells with GLUT4 proteins directly inserted into the plasma membrane have been detected [19, 20, 42]. A great advantage of flow cytometry lies in the ability to analyze a large number of single cells in a short period of time. Although FACS allows for the analysis of dynamic processes (e.g., glucose transport), flow cytometers are expensive instruments, and sample preparation is still time-consuming [43, 44].
2.4. ELISA-Guided binding assay
Enzyme-linked immunosorbent assay (ELISA) detects antigen-antibody reactions by employing covalently bound enzyme-antibody compounds [45]. This immunological assay has previously been used to study GLUT4 trafficking in different cell types and is often used in cells stably expressing myc-tagged GLUT4. Commonly, surface myc-tagged GLUT4 is measured in intact, nonpermeabilized cells using an antimyc antibody. Spectrophotometric analysis of the color change resulting from the enzyme-substrate reaction on a secondary antibody allows for the quantification of GLUT4 [21, 22, 46]. The distinction between surface GLUT4 and total GLUT4 has been achieved by comparing the ELISA results of sonicated and unsonicated samples using peripheral blood mononuclear cells of sled dogs [47, 48].
In general, ELISA is a simple procedure that is easy to perform and provides high specificity and sensitivity, as it is based on antigen-antibody reactions. However, the protocol includes numerous washing, binding and incubation steps, thus making this method time-consuming, labor-intensive and prone to errors. Additionally, ELISA is susceptible to false-positive or -negative results due to nonspecific binding and cross-reactivity of secondary antibodies [49]. As opposed to flow cytometry, limited throughput and the inability to analyze multiple antigens simultaneously are additional limitations of ELISA-guided binding assays in this context [45].
3. Microscopy-based methods
The predominant microscopy-based methods to detect and quantify GLUT4 and its translocation to/from the plasma membrane are electron microscopy and light microscopy techniques, including confocal laser microscopy, total internal reflection fluorescence (TIRF) microscopy and fluorescence resonance energy transfer (FRET), all of which are also combined with superresolution techniques.
3.1. Immunoelectron microscopy
Identification and quantification of endogenous GLUT4 proteins is normally performed by immunolabeling with an antibody directly targeting GLUT4 and a secondary antibody or protein A conjugated to a gold particle and visualized by electron microscopy. This method was used if tissue samples from nontransgenic animals were examined. In vitro, cells are often transfected with recombinant DNA coding for GLUT4 fused to an exofacial HA or myc epitope and/or a C-terminal fluorescence protein for easier detection. The exofacial epitope is then detected by immunolabeling in nonpermeabilized cells to identify GLUT4 on the plasma membrane, and the fluorescent protein can be used to quantify total GLUT4.
In cryoelectron microscopy, cryosections of tissues and cells are stained with an antiGLUT4 antibody. Thus, if the cell or tissue expresses GLUT4 endogenously, no recombinant DNA construct is necessary. After staining with a primary antibody, either a secondary antibody or protein A conjugated with a gold particle is applied to quantify GLUT4 in different compartments. For quantification, gold particles in close proximity (15–100 nm) to visible compartments are counted [50]. Normally, more than one cryosection is analyzed per condition [50, 51]. To account for nonspecific labeling, the counts of gold particles in samples processed without a primary antibody [52] or in cell samples not expressing GLUT4 [53] but processed equally to samples of interest were determined and subtracted, which can also be done by using a GLUT4-negative compartment, for instance, the mitochondria, for nonspecific labeling identification [51]. Another background correction method is to distribute dots randomly on microscopic pictures without gold labeling at a density similar to the labeled samples. Then, the number of dots per compartment is counted and subtracted from the positive signal (pictures with gold labeling) [50]. For normalization, the number of gold particles per compartment is expressed as the percentage of gold particles per cell [54] and divided by the surface [52] or length of the compartment, or a defined length is analyzed [51]. Mayhew et al [55] developed a method based on a contingency table analysis that can be used on raw counts of gold particles to identify the compartment with the highest influence on differences between sample groups.
In an elegant combination of techniques, Hodgson et al [56] linked light microscopy and electron microscopy to develop a correlative light electron microscopy (CLEM) technique to quantitatively study GLUT4 trafficking. The authors developed stably expressing pXLG3.HA.GLUT4. GFP 3T3-L1 adipocytes by lentiviral transduction, which were serum starved, stimulated with insulin and fixed before processing for CLEM. The technique allowed imaging of the same cell under a light microscope based on its fluorescence and under an electron microscope based on gold labeling. Key process steps involved cryosectioning, light microscopy imaging, immunolabeling, TEM imaging, retracing and quantification.
While immunoelectron microscopy has the highest resolution of the methods presented here, sample processing is quite labor-intensive, and live cell imaging is not possible. Thus, this method was used mostly to identify the distribution of and changes in GLUT4 in different compartments in unstimulated cells or cells treated with different agents after a defined time lapse.
3.2. Fluorescence microscopy
Fluorescence microscopy has been widely applied to fixed tissues, cells and cell fragments. Importantly, fluorescence microscopy also allows live cell imaging, enabling the visualization of GLUT4 trafficking to the plasma membrane. Several approaches have been implemented, which are described in the following chapters. A comparison of the different labeling and microscopy strategies used to track GLUT4 translocation is displayed in figure 2.

Figure 2. Fluorescence microscopy techniques used for the analysis of GLUT4 translocation. Comparison of different GLUT4 labeling strategies (A): GLUT4 can be labeled by fluorescent or gold particle tagged antibodies, or genetically encoded fluorescent proteins. Microscopy approaches for a quantitative analysis of GLUT4 translocation (B): Transmission electron microscopy (TEM) in which a beam of electrons is transmitted through a specimen to form an image, which bases on the interaction of the electrons with the sample as the beam is transmitted through the specimen [56, 57], confocal microscopy which increases optical resolution and contrast of a micrograph by means of using a spatial pinhole to block out-of-focus light in image formation [28], total internal reflection (TIRF) microscopy which allows imaging of fluorescent molecules located close to the glass/specimen) interface by employing an evanescent wave for excitation of the fluorophores instead of direct illumination via light delivered [58], and various techniques that allow images to have resolutions higher than those imposed by the diffraction limit, including structured illumination microscopy (SIM)-TIRF [59], sample thinning enhanced resolution microscopy (STERM) [60], stimulated emission depletion (STED) microscopy [61, 62], fluorescence photoactivation localization microscopy (FPALM)-TIRF [63], direct stochastic optical reconstruction microscopy (dSTORM)-TIRF [64].
Download figure:
Standard image High-resolution image
3.2.1. General labeling strategies for glut4 visualization by traditional wide-field microscopy
Fixed cells and tissues can be labeled with an antiGLUT4 antibody and a fluorescently labeled secondary antibody to quantify GLUT4 in different compartments [50, 65, 66].
It is also possible to transfect cells with a fusion protein, such as HA-GLUT4-GFP, and transgenic mice expressing the same construct [67] to study the ratio between internal and plasma membrane-inserted GLUT4 in vitro and ex vivo. For this purpose, cells were fixed and stained with an antiHA antibody and a fluorescently labeled secondary antibody. The antibodies had access only to surface HA, as no detergent was added. After correction for nonspecific labeling (cells not expressing HA-GLUT4-GFP or staining without a primary antibody), the ratio between surface fluorescence by immunolabeling and GFP fluorescence was determined, accounting for differences in recombinant protein expression and allowing for quantification of the portion of GLUT4 inserted into the plasma membrane [30].
A method to measure internalization of GLUT4 is by incubating live cells with antiHA antibody for a defined pulse time. Then, the cells are fixed, and a fluorescently labeled secondary antibody is used for surface immunolabeling. The secondary antibody is washed off, and the cells are permeabilized with detergent. A secondary antibody conjugated with another fluorophore is used, and the ratio between those two fluorophores represents the internalization rate [68].
A similar assay can be used to detect the amount of GLUT4 that has translocated at least once to the cell surface. For this assay, cells are incubated with an antiHA antibody. The antiHA antibody binds stably to the HA epitope and is not removed upon translocation. At different timepoints, excessive antibodies are washed off, and cells are fixed and permeabilized. AntiHA-labeled GLUT4 is detected with a secondary antibody conjugated to a fluorophore, and the ratio of the fluorophore to GFP is determined. With this assay, each GLUT4 molecule that has entered the plasma membrane can be detected. When the ratios of the different timepoints are plotted against the time post incubation, the exocytosis/cycling rate can be determined [69].
Morris and colleagues [70] approached the issues many laboratoriess had with using primary and cultured adipocytes by developing an epitope- and GFP-tagged version of GLUT4 in HeLa cells. They compared the translocation of tagged GLUT4 in both cell types and observed similar kinetics using orthologous trafficking machinery; however, the magnitude of the insulin-stimulated translocation of GLUT4 was found to be smaller in HeLa cells. The more experimentally tractable, human model system in HeLa cells was further used for a prototype siRNA screen in which two new regulators were identified. The authors used a whole series of techniques for their work, including conventional live cell imaging, TIRF microscopy, immunofluorescence and FACS.
Changou et al [71] reported a detailed protocol for another cell type in GLUT4 insulin signal regulation research, primary hypothalamic neurons. They applied GFP-GLUT4 protein to track GLUT4 membrane translocation upon insulin stimulation. Time-lapse images together with deconvolution microscopy delivered high-speed, high-resolution images without significant damage to the neurons.
Patki et al [72] applied high-speed microscopy using extremely low light exposure times without photobleaching or photodamage over ∼ 30 min to visualize the process of GLUT4-eGFP translocation in response to insulin in single 3T3-L1 adipocytes. Analysis of four-dimensional images (3-D over time) demonstrated for the first time the regulation of long-range motility of GLUT4-containing vesicles through interaction with microtubule- and actin-based cytoskeletal networks.
3.2.2. Confocal microscopy
Confocal microscopy is a technique in optical imaging that selectively collects light from thin optical sections defining single focal planes within the sample. Excitation light is commonly produced by a laser to generate high intensities of fluorescence from the focal spot. By using point illumination via a spatial pinhole, out-of-focus signals are eliminated, and structures appear more sharply defined [73].
In a very practical application in sports research, Bradley et al [74] tested changes in subcellular GLUT4 distribution by confocal immunofluorescence microscopy following endurance training (ET) and sprint interval training (SIT) and found that GLUT4-containing clusters increased in muscle fibers, detected via GLUT4 fluorescence intensity. The increase in peripheral localization and protein content of GLUT4 following ET and SIT is likely to contribute to the improvements in glucose homeostasis observed after both training modes.
One of the main advantages of fluorescence microscopy is the possibility of live cell imaging. With live cell imaging, the translocation of the fusion protein myc-GLUT4-GFP to the plasma membrane can be visualized in real time, and videos can be used for quantitation of GLUT4 translocation to the plasma membrane [28]. Fujita et al [75] incubated 3T3-L1 adipocytes expressing myc-GLUT4-ECFP with a quantum dot Fab fragment of an antimyc antibody to label surface GLUT4. The advantage of quantum dots is their higher resistance to photobleaching than fluorescent proteins. After incubation to facilitate endocytosis, single molecules could be followed by live cell imaging, allowing for the analysis of intracellular GLUT4 dynamics in different compartments and upon insulin stimulation at a single-molecule resolution [61]. The speed at which stained GLUT4 molecules move is often stated in μm/s (velocity) or in μm2 (mean-square displacement, MSD), with the latter discriminating between active transport and diffusion.
Sadler et al [76] reviewed the role of posttranslational modifications of GLUT4 on its function and insulin-regulated trafficking. The authors described transport through endosomes, the trans Golgi network and an insulin-sensitive intracellular compartment, termed GLUT4-storage vesicles or GSVs, in a 10-step process for which various techniques were applied.
In addition, confocal microscopy was used to generate giant plasma membrane vesicles from cells that were treated with different autofluorescent substances to eliminate background fluorescence. Although this approach has some drawbacks, such as a lack of live imaging and a rather low throughput, confocal microscopy enables the detection of fluorescently labeled GLUT4 in the plasma membrane without background fluorescence and thereby reduces false-positive GLUT4 translocation-inducing substances in GLUT4 translocation-altering screens [33].
Recently, Komakula et al [77] introduced a high-content screen for real-time readout of GLUT4 translocation. The nuclei of CHO cells expressing myc-GLUT4-eGFP were stained with Hoechst 33342 to identify the perinuclear region. Then, the fluorescence intensity ratio of the cell periphery to the perinuclear region was used to estimate GLUT4 translocation. With this assay, thousands of cells were analyzed in parallel through automated microscopy and image analysis. Although the presented screening system allows for the analysis of many cells in real time, the sensitivity is rather limited, as the highest fluorescent ratio increase upon insulin stimulation is lower than 15% compared to the control.
Via identification of a novel splice variant of AS160 (Akt substrate of 160 kDa), a protein in the Akt (protein kinase B [PKB]) signaling cascade that mediates GLUT4 translocation to the plasma membrane and coexpression with GLUT4, Baus et al [78] developed an assay to detect the insulin-stimulated glucose uptake rate in rat L6 myoblasts. The increased amount of GLUT4 on the cell surface was measured by confocal imaging in 384-well plates and fixed cells. GLUT4 was detected via a Myc-tag and immunostaining using Alexa Fluor 488 labeling. This classical phenotypic assay represents an example of a high-throughput screen to quantitively assess GLUT4 translocation without costly and time-intensive differentiation. Importantly, the extended assay window delivered high Z'-values, unusual or unwanted modes of action of test compounds were delectable, and GLUT4 translocation activators and insulin sensitizers were revealed.
3.2.3. TIRF microscopy
TIRF microscopy is an advanced fluorescence microscopy setting in which, due to an excitation angle lower than the critical angle, the excitation beam is reflected completely but generates an evanescent wave that travels along the interface between two media and decays exponentially. This wave has a very small optical section depth and thus excites only fluorescent molecules in a very narrow range of up to a few hundred nm, thereby reducing background noise and photobleaching and increasing the resolution in comparison to other fluorescence microscopy methods [79].
Live cells expressing a GLUT4-fluorescent fusion protein are normally used in this setup, which enables dynamic GLUT4 detection in or close to the plasma membrane [79]. As demonstrated by Lanzerstorfer et al [6], by using a myc-GLUT4-GFP construct, the increase in fluorescence signal detected via TIRF was assigned to a functional insertion of GLUT4 into the plasma membrane [6]. The generated results should be confirmed with complementary in vitro and in vivo methods to reduce false assumptions [32, 80, 81]. An algorithm has been developed to identify full fusion of vesicles with the plasma membrane [82]. The quantum dot method explained in section 4.2.2 can also be used in combination with a TIRF setup to detect single GLUT4 molecule movement in close proximity to the plasma membrane after endocytosis [75]. In addition, an exofacial HA or myc epitope with fixation (but not permeabilization) and immunolabeling can be used to investigate the insertion and distribution of GLUT4 into the plasma membrane [83]. Furthermore, surrogate molecules, such as leucyl and cystinyl aminopeptidase (LNPEP, also known as IRAP) and vesicle-associated membrane protein 2 (VAMP2), fused to a pH-sensitive fluorescence probe that colocalizes with GLUT4 have also been applied to detect full fusion of GLUT4 vesicles with the plasma membrane [83, 84], but the ability of these molecules to specifically detect GLUT4 translocation has been questioned [85]. Vesicular structures can be detected via semiautomated image analysis, and the number of fusion events is often normalized to the timespan of observation and plasma membrane surface [83]. Burchfield et al [85] developed another construct consisting of GLUT4 fused to extracellular pHluorin, a pH-sensitive fluorescent probe and the intracellular fluoroscient protein tdTomato. Upon insertion of GLUT4 into the plasma membrane, pHluorin starts to fluoresce due to pH changes, enabling clear discrimination between GLUT4 vesicles approaching the plasma membrane and fusion. The objective-type TIRF microscopy setup used in the abovementioned studies has a high sensitivity but limited throughput. To overcome this issue, a prism-type TIRF microscopy method was developed, allowing for observation of fluorescence signals in the region of the plasma membrane for multiple wells at once but with reduced sensitivity [33].
Wasserstrom et al [86] provide a detailed protocol of their TIRF experiments using various GLUT4 constructs to monitor the last events involved in insulin-regulated GLUT4 translocation and glucose uptake in both cultured 3T3-L1 adipocytes and primary adipocytes isolated from rodents and humans together with an excellent literature overview of the contributions and progress of the TIRF technique for GLUT4 biology. In HA-GLUT4-GFP and HA-GLUT4-mCherry, the exofacial HA tag allowed detection of GLUT4 inserted into the membrane following fusion. A photoactivatable probe, EOS, was used for single GLUT4 molecule tracking of monomers in the plasma membrane. Coexpression of fluorescently tagged GLUT4 and IRAP-pHluorin allowed detection of the exact fusion event, and a double-tagged GLUT4 construct was shown to be useful for characterization of cell heterogeneity.
Qu et al [87] have applied quantum dots (QDs), which are more photostable and brighter, targeted to GLUT4myc to measure the translocation of GLUT4 in live L6 cells by long-term single particle tracking.
Huang et al [58] reported another set of TIRF experiments in the plasma membrane of 3T3-L1 adipocyte bile structures containing eGFP-GLUT4. Their contribution was mainly a specific piece of software (Fusion Assistant) that enabled exocytic docking/fusion kinetics analysis at high speed with and without insulin stimulation. Two-color TIRF microscopy using fluorescent proteins fused to clathrin light chain or GLUT4 revealed that punctate structures on the cell surface are not exocytic fusion sites but clathrin-coated patches.
3.2.4. Superresolution microscopy
Superresolution (SR) techniques often comprise a photoswitchable fluorescent probe coupled to GLUT4 and a TIRF microscopy setup for excitation to increase the resolution down to approximately 30 nm [64]. Lizunov et al [63] used a technique called fluorescence photoactivation localization microscopy (fPALM) and an HA-GLUT4 construct fused to an intracellular photoswitchable fluorescent tag (EOS) to measure GLUT4 movement and restriction inside the plasma membrane. As a TIRF setup was applied to excite the samples and the density of photoswitched constructs was kept low, only HA-GLUT4-EOS molecules inside the plasma membrane were able to photoswitch, and movement of single molecules could be followed and characterized [63].
Another SR method uses the TIRF microscopy setup in conjunction with direct stochastic optical reconstruction microscopy (dSTORM), in which HA-GLUT4-GFP was expressed in adipocytes. Cells were fixed but not permeabilized and immunolabeled with Alexa Fluor 647, a photoswitchable fluorophore conjugated to an antiHA antibody. The location of the molecules was determined by repeated cycles of switching Alexa Fluor 647 off and on again, allowing grouping of images of single molecules into a Gaussian distribution to precisely determine the location of single GLUT4 molecules. In addition, quantification of GLUT4 clusters in the plasma membrane is possible (cluster density, mean number of molecules per cluster and distribution of clusters between different samples/treatments) [64].
SIM was also combined with fluorescence microscopy and a TIRF microscopy setup (termed TIRF-SIM) to detect GLUT4 translocation to the plasma membrane. During SIM, pictures are recorded with different phases and rotation angles, and using a Fourier transformation, a superresolution image can be calculated; however, SIM does not enable single-molecule detection and tracking. SIM was used to study the translocation of myc-GLUT4-GFP from intracellular vesicles (detected by SIM) to the plasma membrane (measured by TIRF-SIM) in live cells [59, 88].
The size distribution of GLUT4-containing compartments up to very small structures was studied with another SR microscopy technique termed stimulated emission depletion (STED). In STED, a second laser beam is used to de-excite the fluorophore after primary excitation (here: GFP), thus generating spatially narrow signals when compared to confocal laser scanning microscopy [61].
The resolution of the z-plane was also increased by a method called sample thinning enhanced resolution microscopy (STERM). In this method, muscle biopsies were cut into 70 nm sections, thus increasing the z-plane resolution of confocal laser scanning fluorescence microscopy, which is normally approximately 600 nm, allowing us to analyze the detailed GLUT4 distribution inside the sample [60].
3.2.5. Fluorescence resonance energy transfer (FRET)
Historically, FRET is within the most often used techniques in ensemble average fluorescence as well as in single molecule measurements, both in vitro and in cellular experiments. Two labeled reagents are detected if they are closer together than 10 nm. Several methods of FRET detection are applied. In addition to the gold standard, almost artifact-free acceptor sensitization, donor quenching has been established as the standard method for measuring the vicinity of molecules in cell biology [89]. Internalization of GLUT4 was measured in HeLa cells. Quite elegantly, sialylated GLUT4 was produced by bioorthogonal chemistry and click chemistry in Alexa Fluo 555-labeled form. Total GLUT4 (both internal and extracellular) was labeled with GFP. After insulin removal from the media, GLUT4 internalization was detected by changing the FRET signal in a TIRF setup [90, 91]. Hosoya et al [92] used FRET to study GLUT4 vesicle trafficking in living adipocytes. After insulin stimulation, GFP-tagged GLUT4 vesicles translocated from the perinuclear (N) to plasma membrane (PM), and the ratio of the luminance (PM/N) was increased. FRET between lipophilic membrane dyes and GFP provided detection sensitivity. Dynamic imaging was enabled by GFP tagging, a breakthrough in the glucose regulation mechanism that provided key progress from biochemical or static cell biological techniques such as immunofluorescence microscopy [93].
4. Conclusions
Insulin-induced GLUT4 translocation is an essential step for the cellular absorption of glucose in muscle and fat cells, thereby lowering the blood glucose level. The regulation of GLUT4 translocation and dynamics has been investigated thoroughly by different classic biochemical and microscopic methods. Biochemical methods often comprise several preparation steps to monitor the GLUT4 distribution in different compartments, leading to a higher risk of introducing errors and a low resolution, but they are more cost effective and easier to set up. Microscopic methods, however, often depend on the introduction of a recombinant construct and more expensive equipment. User training and experience are necessary to obtain viable results, and the throughput is limited, for example, in comparison to flow cytometry, with which thousands of cells can be analyzed at a single-cell level within minutes. However, live cell imaging, single molecule resolution and superresolution can be achieved by resolving translocation and single GLUT4 molecule movement with the currently highest possible accuracy. In the future, particularly TIRF microscopy in superresolution, the FRET detection mode is expected to benefit from new developments in bioorthogonal labeling technology to increase the specific transport information as a function of space and time. More photostable dyes together with site-specific tagging chemistry might then hopefully also find use in drug discovery, mainly for medium-throughput screening and for mechanistic profiling of lead compounds.
Acknowledgments
This research was funded by Christian Doppler Forschungsgesellschaft (Josef Ressel Center for Phytogenic Drug Research, Wels, Austria). It was also funded by a research project of the Austrian Competence Centre for Feed and Food Quality, Safety and Innovation (FFoQSI). The COMET-K1 Competence Centre FFoQSI is funded by the Austrian federal ministries BMK and BMDW and the Austrian provinces of Lower Austria, Upper Austria and Vienna within the scope of COMET - Competence Centers for Excellent Technologies. The COMET program is handled by the Austrian Research Promotion Agency FFG.
Data availability statement
No new data were created or analysed in this study.
Conflict of Interest Statement
The authors have declared that no conflicting interests exist.